2020 Market Research Conference Speaker Gender Tracker #MRX #NewMR
This list shows the gender ratio of speakers at marketing research and related conferences during 2020.
These data are not 100% accurate. I am not always able to identify whether a speaker is male or female based on their name and/or photo, and online and printed programs don’t reflect last minute changes to the schedule. However, given that conference organizers want to project the most positive reflection of their conference program, I am assuming the available programs are within a reasonable margin of error. If you are able to provide more accurate numbers, I would be pleased and grateful to make corrections.
And yes, there is far more to diversity than gender. Diversity of age, ethnicity, ability/disability, sexuality, and more also matter. But gender is a start.
Please contribute: If you have a PDF or image of a conference program, even if it’s from 2015, email it to me so I can include the results in the list.
Let’s create the change we want to see.
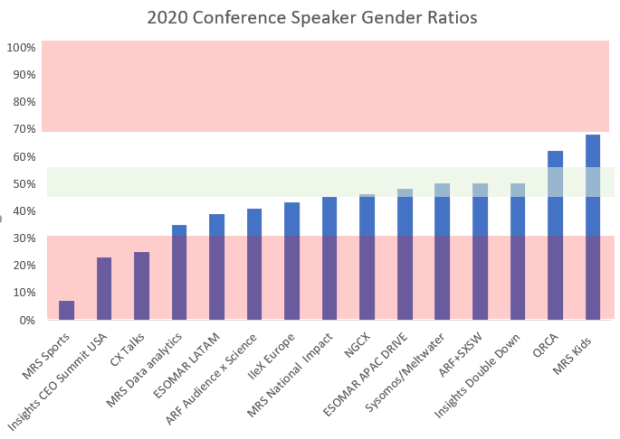
- MRS Sports, UK, February, 7%
- Insights CEO Summit, USA, January, 23%
- MRMW, Amsterdam, June, 23%
- CX Talks, Dallas, March, 25%
- MRS Data analytics, London, February, 35%
- ESOMAR, Lima, April, 39%
- ARF Audience x Science, New York, April, 41%
- IIeX, Amsterdam, March, 43%
- MRS National Impact, London, March, 45%
- NGCX, USA, March, 46%
- ESOMAR DRIVE, Delhi, March, 48%
- NGCX, California, March, 48%
- ARF+SXSW, Texas, March, 50%
- Insights Double Down, Las Vegas, February , 50%
- Sysomos/Meltwater, London, March, 50%
- Qualtrics experience summit, Salt Lake City, March, 53%
- NewMR Festival, Virtual, March, 50%
- QRCA, Texas , January, 62%
- MRS Kids, UK, January, 68%
- Advancing Research 2020, New York, March, 69%
How To Find Speakers
 Be part of the Women in Research 50/50 initiative and take advantage of their speaker database.
- Review the speaker lists of other conferences.
- Maybe you don’t need an experienced speaker. Maybe you need to give opportunity to a brand new speaker.
- Use LinkedIn to connect with experts in the city where your conference will take place.
- Use Twitter to connect with experts. I have bookmarked many lists of women who are experts in areas such as artificial intelligence, branding, data science, analytics, cyrpto, neuroscience and much more.
- In addition, you can use the GenderAvenger toolkit to nominate conferences that are succeeding, take the GA Pledge, or call out conferences that need improvement.
Gender Ratios of Years Past:
These data prove I am worth 80% of what my male research colleagues are worth #MRX #NewMR
As a freelance market research writer (my service sheet is here), I regularly check my public profiles to make sure they’re up to date. This time, I checked my profile on Savio, a marketplace connecting market research buyers with research experts, which is maintained by GreenBook.
 After clicking around the website for a bit, I realized that every researcher’s hourly rate was completely and easily transparent, not hidden behind multiple clicks and privacy walls. My brain gears sped up….
People don’t talk about salaries which is a problem. Freelancers don’t know if they’re being paid what they deserve. Women don’t know if they’re being paid less than their equivalent male counterparts. So in that regard, I have to thank Savio and Greenbook for opening the black box and helping researchers see a piece of reality.
I had planned to go see the new Solo movie but this lovely little dataset just presented itself to me. Plus, I hear there isn’t any ukulele in this movie so let’s do this.
I downloaded the data and removed the business profiles. That left me with 191 individuals who provided an hourly rate, country, and the types of work they do. I manually gendered all the profiles. Obviously, I may have gotten a few wrong as I am not the gender police (much better said by Effin Birds) – 83 women, 107 men, and 1 unknown.
 As all good data people do, I started with a frequency distribution. A few things were immediately apparent. 1) 3% of men and 4% of women VASTLY undervalued themselves. If you have listed an hourly rate under $50 per hour, go to your profile right now and FIX IT. I never want to see an hourly rate less than $50. From any freelancer. For anything. 2) 6% of men and 2% of women listed stunningly high rates, a couple over $1000 per hour. These rates might be for bragging, for negotiating, or for real but if you can command them, more power to you. 3) Women were far more likely to undervalue themselves while men were far more likely to overvalue themselves. [“THAT was a pencil in the neck moment!” -Luke Sklar]
 Maybe group averages would paint a different picture but nope. Across all 191 rates, women asked for 81% of what men did – $168 versus $207 per hour.I tried excluding outliers from 12 people whose rates were below $50 or above $500. Women still asked for 81% of what men asked – $153 versus $189 per hour. I then focused on the three countries with at least 8 researchers. In Canada, two women and myself listed rates that were a paltry 40% of what five men listed. Among 123 US researchers, women asked for a somewhat better 80% of what men asked for. I am thrilled, though, to offer a huge hurray to the 14 researchers in the UK where hourly rates listed by men and women were equal. (Okay, women can increase their hourly rates by $5 in the UK.)
Maybe it’s because women do “less valuable” work so I tried grouping by the 25 different type of work people specified they did. Major caveat though – these data do not account for the fact that someone might charge different rates for different types of work.
I’ll pick out two examples from the chart since it’s a little bit complicated and uses two axes. At the left of the graph, among people who offer legal research services, women specified an hourly rate of $169 compared to men at $136. Thus, women listed a rate that was 124% of what men listed. There exist four categories of work where women listed a higher hourly rate than men – Legal Research, Field Services, Recruiting, and Support Services.
Second, at the right of the chart, among researchers who conduct Mystery Shopping, women listed an hourly rate of $138 compared to men at $225. Women listed a rate that was 61% of what men listed. There exist 21 categories of work where men listed a higher hourly rate than women.
I don’t know if these differences are because women undervalue themselves or because men overvalue themselves. I don’t know how much of these differences exist for bargaining or bragging purposes.
But I do know this. As much as I love statistics, t-tests and chi-squares aren’t necessary to determine the likelihood that these results are due to chance. Correlations and Cohen’s D aren’t necessary to determine whether the effect sizes are meaningful.
Women ask for less financial compensation than do men.

Women, my advice to you is simple. Give yourself a raise. Give yourself a giant fucking raise. (I’m channeling my inner Cindy Gallop and I urge you to follow this amazing woman on Twitter or LinkedIn and personally talk about your salary with her here.)
 If you’re currently in the $50 to $99 bucket, up your rate to land in the $100 to $149 bucket. If you’re in the $200 to $249 bucket, give yourself a raise into the $250 to $299 bucket. Don’t think twice, it’s all right.
If you’re curious, I may have started my day claiming my worth to be 80% of what my male research colleagues felt they were worth.
It sure didn’t end that way.
You might wish to look at:
2018 Market Research Conference Speaker Gender Tracker #MRX #NewMR
 This list shows the gender ratio of speakers at marketing research and related conferences during 2018.
These data are not 100% accurate. I am not always able to identify whether a speaker is male or female based on their name. Online programs aren’t always up to date, and printed programs often change at the last minute and don’t reflect who was actually on stage. If you are able to correct my numbers, I would be grateful for the help.
And yes, there is far more to diversity than gender. Diversity of age, ethnicity, ability/disability, sexuality, and more also matter. But let’s at least measure what we can from conference programs.
Please contribute: If you have a PDF or image of a conference program, email it to me so I can include it in this list.
FYI, I put a ⭐ beside any conference between 45% and 55% and a 👎🏻 beside any conference under 30% or over 70%.

- QRCA, Arizona, January: 19 female, 7 male=73% female (Qual research has more female than male specialists)
- Qual Worldwide, Spain, May: 20 female, 9 male = 69% female
- Qual360, Washington, March: 17 female, 11 male speakers = 61% female
- ESOMAR World, Amsterdam, March: 15 female, 11 male = 58% female
- Customer Experience Strategies Summit, April: 15 female, 12 male=56% female
- ⭐ NewMR Festival, online, February: 16 female, 13 male=55% female
- ⭐ TTRA, June, 49 female, 41 male=54% female
- ⭐ IMPACT MRS Annual, March: 45 female, 42 male = 52% female
- ⭐ Market Research Summit, London, May, 18 female, 18 male = 50% female
- ⭐ ConsumerXscience, The ARF, March, New York, 24 female, 25 male= 49% female
- ⭐ Africa Forum 2018 AMRA, Nairobi, February: 19 female, 20 male=49% female
- ⭐ MRMW APAC, June: 9 female, 10 male = 47% female
- ⭐ MRMW NA, April: 21 female, 24 male = 47% female
- ⭐ MRIA, Vancouver, May: 25 female, 30 male=45% female
- ⭐ Sentiment Analysis Symposium, New York March, 9 female, 10 male=45% female
- The Insights Show, London, March: 19 female, 25 male= 43% female
- CX Next, Boston, April: 10 female, 13 male = 43% female
- TMRE IN FOCUS, Chicago, May: 10 female, 13 male = 43% female
- Quirks LA, January: 45 female, 63 male=42% female
- Insights NEXT, April, New York: 28 female, 38 male=42% female
- Customer Experience & Digital Innovation, San Francisco, April: 5 female, 7 male = 42% female
- ESOMAR MAIN FEST Latam, Buenos Aires, April: 23 female, 33 male = 41% female
- Quirks Brooklyn, February: 55 female, 81 male=40% female
- FUSE Brand & Packaging, New York, April: 19 female, 28 male = 40% female
- SampleCon, February, Texas: 13 female, 25 male = 39% female
- IIEX, Amsterdam, February: 50 female, 84 male=37% female
- Qualtrics experience summit, March, Utah, 32 female, 57 male = 36% female
- IIEX, Atlanta, June: 44 female, 85 male speakers = 34% female
- Sysomos Summit, February, New York: 6 female, 12 male=33% female
- Sysomos Summit, London, April: 4 female, 10 male = 29% female
- 👎🏻 Insights CEO Summit, January, Florida: 4 female, 13 male = 24% female
- Insights50, May 2, New York: 1 female, 4 male=20% female
- 👎🏻 Sawtooth conference, March, Florida, 12 female, 58 male= 17% female
—————————————————————————————————————–
- MRMW Europe, September: female, male = % female
- PMRC : female, male=% female
- AMAART Forum, June: female, male=% female
- AMSRS, September: female , male =% female
- Big Data & Analytics for Retail Summit, June: female, male=% female
- CRC, October: female, male=% female
- CX Talks, October: female, male= % female
- ESOMAR Big Data World, November: female, male=%female
- ESOMAR Congress, Berlin, September: female speakers, male speakers =% female
- ESOMAR Global Qual, November: female, male=% female
- ILC Insights Leadership Conference (Insights Association), September, female, male=% female
- Insights Corporate Researchers Conference, October, Florida: female, male=% female
- Insights Leadership Conference, November, San Diego: female, male=% female
- MRIA Net Gain, November, Toronto: female, male=% female
- MRMW Europe, November: female, male=% female
- MRS Driving Transformation Through Insight, October: female, male= % female
- MRS, Customer Summit , November: female, male= % female
- MRS, Financial, November: female, male=% female
- MRS, Methodology in Context, November: female, male=% female
- Omnishopper International, November, female, male =% female
- Qual360 APAC, Singapore, October: female, male=% female
- Sentiment, Emotional & Behavioral Analytics, July: female, male=% female
- Sysomos Summit, September: female, male=% female
- TMRE, October, female, male=% female
Gender Ratios of Years Past:
- The gender split in #MRX conferences: 2017 edition
- The gender split in #MRX conferences: 2016 edition
- The gender split in #MRX conferences: 2015 edition
- Note: 2014 ratios were done in individual posts
How many women do you follow on Twitter? #MRX #NewMR
One of the best ways to identify lots of diverse people to speak at conferences is to follow lots of diverse people on social media. But do we?
With that question in mind, I turned to https://www.proporti.onl/, a website that says…
“Estimate the gender distribution of your followers and those you follow, based on their profile descriptions or first names. Many tech leaders follow mostly men, but I want to follow a diverse group of people. Twitter Analytics doesn’t tell me the gender distribution of those I follow, and it doesn’t try to identify gender-nonbinary people. So I built this tool for myself and put it on GitHub. It’s inaccurate and it undercounts nonbinary folk, but it’s better than making no effort at all. I want you to be able to do this, too. Estimate the distribution of those you follow and see if there’s room to improve!”
I’m cool with that so I turned to this tweet by Antonio Santos as a good place to start within the market research industry. I entered each one of these accounts (excluding @MRXblogs which is a bot that follows no one but me), in order to see how we’re doing.
On average, about 36% of the people these market research influencers follow are women.
Sadly, only 3 people follow roughly equal numbers of men and women, and only 2 people follow more women than men (you can guess who!). I’m one of them, but that’s only because I actively follow women and I’ve been using proporti.onl to monitor my status. Unfortunately, for about 43% of us, one third or fewer of the people we follow are women. The curve is far from expected and could use a lot of improvement.

Fortunately, it’s easy to change that proportion. Lots of people have created lists of women on Twitter who specialize in different areas including marketing research, data science, analytics, STEM, and more. I keep a nice selection of those lists on my twitter account right here. However, here are some of my favourite lists.
- Women in Data Science: I love this list. Search through the 1200 members and you’ll find tons of women who specialize in data visualization, statistics, neuroscience, RStats, business intelligence, artificial intelligence, and more.
- Women Game Developers: 100 women who know AI, storytelling, games, user experience, digital marketing, customer relationship management.
- BioInfo Women: 600 women who know about EEGs, fMRIs, neuroscience, computer science.
- STEM women: 500 women who know data, engineering, cybersecurity.
- Women in VR: So, um, these 150 experts know VR.
Now it’s your turn. Go check how many women you follow on Twitter, and then head on over to these lists to make some additions! Expand your world!
How do speakers see themselves? A survey of Speaker perceptions
The entirety of this post is available on the Gender Avenger website.
.
Why are women underrepresented as speakers?
 Why are women underrepresented as speakers, particularly at the conferences I go to where half of the audience members are women? Does fear chase them off the stage in disproportionate numbers?
I’ve pondered this question for years but I never knew if my hypothesis was grounded in fact or in stereotype. Fortunately, or unfortunately as the case may be, the opportunity presented itself and here we are pondering real data from a survey I did of 297 male and 252 female computer or data scientists, and market researchers aged 25 to 49 — people who ought to be on their way to securing spots on the conference circuit.
One of the questions in the survey asked people to imagine speaking at an event and to choose any attributes that would describe themselves as a conference speaker. I was careful to include an equal number of both positive and negative attributes so as to avoid leading people to choose a greater percentage of positive (or negative) items.
Curious how men and women viewed thselves? I know you are. Read the entirety of this post on the Gender Avenger website. If you’re braver enough.
2017 Market Research Conference Speaker Gender Tracker #MRX #NewMR
This list shows the gender ratio of speakers at marketing research and related conferences during 2017.
These data are not 100% accurate. I am not always able to identify whether a speaker is male or female based on their name. Online programs aren’t always up to date, and printed programs often change at the last minute and don’t reflect who was actually on stage. If you are able to correct my numbers, I would be grateful for the help.
Please contribute: Some conferences remove their information immediately afterwards. If you have a PDF or image of a conference program, email it to me so I can include it in this list. If you have a paper program, mail it me or do the counts and simply send me the final numbers.
- ESOMAR Global Qual, Porto, November: 25 female, 17 male=60% female
- MRS Driving Transformation Through Insight, London, October: 15 female, 12 male= 56% female
- ⭐️ AMSRS, Sydney, September: 3 female keynotes, 3 male keynotes, 1 female invited, 1 male invited, 28 female speakers, 19 male speakers=53% female
- ⭐️ MRS, Financial, London, November: 11 female, 12 male=48% female
- ⭐️ Qual360 APAC, Singapore, October: 16 female, 17 male=48% female
- ⭐️ TMRE, Orlando, October, 79 female, 88 male=47% female
- ⭐️ MR and CI Exchange, St Louis, May: 13 female, 16 male speakers=45% female
- MRIA, Toronto, May: 25 female speakers, 33 male speakers, 6 female panelists, 4 male panelists, 1 female keynote, 4 male keynotes=44% female
- CRC, Chicago, October: 37 female, 55 male=40% female
- Market Research Summit, London, May, 22 female, 29 male=43% female
- ESOMAR Congress, Amsterdam, September: 62 female speakers, 83 male speakers =43% female
- MRS, Customer Summit 2017, November, London: 6 female, 8 male=43 % female
- MRMW Europe, Berlin, November: female, male=43% female
- IIEX, Amsterdam, February: 52 female, 76 male=41% female
- MRS, Methodology in Context, London, November: 40 female, 6 male=40% female
- Customer Experience Strategies Summit, April, Toronto: 12 female, 18 male=40% female
- Sysomos Summit, February, North Carolina: 16 female, 25 male=39% female
- Sysomos Summit, September , NYC: 6 female, 10 male=38% female
- MRIA Net Gain, November, Toronto: 6 female, 10 male=38% female
- ILC Insights Leadership Conference (Insights Association) Chicago, September, 13 female, 24 male=35% female
- IIEX, Atlanta, June: 58 female, 108 male speakers=35% female
- 👎🏻ESOMAR Big Data World, New York, November: 10 female, 24 male=29%female
- 👎🏻Sentiment Analysis Symposium, New York, June, 14 female, 35 male=29% female
- 👎🏻Omnishopper International, Spain, November, 4 female, 13 male =24% female
- 👎🏻CX Talks, Atlanta, October: 7 female, 25 male=22 % female
- 👎🏻Big Data & Analytics for Retail Summit, Chicago, June: 5 female, 19 male=21% female
- 👎🏻 Sysomos Summit, June, London: 3 female, 14 male=18% female
- 👎🏻 Insights50 (Insights Association), Chicago, October: 1 female, 7 male=13% female
- 👎🏻 AMAART Forum, Seattle, June: 4 female, 32 male=11% female
- 👎🏻Sentiment, Emotional & Behavioral Analytics, July, San Francisco: 4 female, 36 male=10% female
- .
- PMRC Speakers not available online
Gender Ratios of Years Past:
- The gender split in #MRX conferences: 2016 edition
- The gender split in #MRX conferences: 2015 edition
- Note: 2014 ratios were done in individual posts
I thought we had this single-gender #speaker thing sorted out in #MRX #NewMR
Some of you might remember a long-running and regularly updated post I created last year listing the gender ratios at marketing research conferences around the world. I stopped doing it because an entire year of data is sufficient for an industry that depends on data to see what’s happening. The data showed that women were vastly underrepresented as speakers at conferences. Conference organizers could see that this was an industry issue, not a “just them” issue. The data gave us the perfect opportunity to make great progress in how we source speakers.
I’ll admit it can be difficult to see the problem but Twitter and Facebook make the job of spotting single gender panels much easier. Now, I truly don’t care about single gender, or single race, or all young, all old, all differently abled, or whatever the panel bias is. I DO care when the only type of biased panel I ever see is middle-aged, white, male panels. Has any #MRX conference ever had an all black panel not talking about black issues in #MRX ? Or an all woman panel not talking about women’s issues in #MRX? That’s the problem. That’s the statistically improbable problem.
So that’s why posts like this are so disappointing.
There are literally hundreds of Twitter lists labeled as #WomenIn_________, insert industry category. (Some of the relevant lists are on my twitter account.) There are hundreds of websites listing #WomenIn_________. There are Facebook groups, google plus groups (yeah, tons of techies there!), Reddit groups, you name the digital channel, they have #WomenIn___________ groups. There’s #WomenAlsoKnow. There are thousands of lists of women experts if you look for them. You don’t even need to ask a woman/black person/differently abled person if they know another woman/black person/differently abled person who is an expert on a topic. You just need to know how to use the google. Or the internet explorer if you work for a company that still operates in the dark ages.
But with that tweet, and the emails that came my way to complain, I guess I ought to do the counts again. I hope that while we may have not reached peak equality, e.g., at least 45% of one gender, we at least have shown improvement. I hope that instead of 35% of speakers being women, that at least 40% of speakers are women.
Please do send me PDFs of any market research conference agendas you have saved. I’d appreciate the help. So would your friends and colleagues. My gmail address is anniepettit.
Fingers crossed!
A behind the scenes look at choosing speakers for the Worldwide Conference on Qualitative Research, by Susan Abbott #MRX #Diversity
Hi readers,
This is a guest post from my colleague Susan Abbot who was on the speaker selection committee for the Worldwide Conference on Qualitative Research. After reading an earlier blog post of mine about diversity of speakers, Susan decided to run the numbers on the conference and see how the conference did. These numbers can be seen in context with others on my conference comparison post. I would be thrilled if other conferences followed suit because this type of transparency is how we can really determine where any problems may lie.
Overall
We received multiple proposals from the same speakers, in varying combinations. Any given name was only counted once, and counted in the place first recorded, which would have been in the order received.
Some proposals had more than one speaker. We counted only primary and secondary speakers.
Our keynote speaker is female. We did a search, and invited this individual to speak, we did not solicit proposals. Factors considered: wanted an expert on futures, wanted an expert based in Europe, wanted someone who would connect with our audience, wanted to be within our budget. We looked at three speakers from one organization as finalists, two males and a female, and felt the woman would connect better because she had some qualitative research background. She is not included in the numbers shown below.
Proposals received from:
| Primary speaker gender | Secondary speaker gender | Totals | ||
| Total count female | 33 | 12 | 45 | 57% |
| Total count male | 26 | 8 | 34 | 43% |
| Totals | 59 | 20 | 79 | 100% |
Program
The final program line-up is as follows.
I would note here that some people who were offered a speaking slot (including both males and females) declined the offer, for a variety of reasons.
As well, I believe one male secondary speaker was added after the session was accepted, and I didn’t try to take that into account.
| Primary speaker gender | Secondary speaker gender | Totals | ||
| Final Program Female | 19 | 6 | 25 | 58% |
| Final Program Male | 13 | 5 | 18 | 42% |
| Totals | 32 | 11 | 43 | 100% |
Process
We have a speaker committee of three people who have done a lot of conference planning work over the years.
In addition, I was involved in the initial discussions with the committee, and Kendall Nash, my co-chair, also participated in some of the final selections.
A consideration in forming the committee was to have at least one European (which we did, from the UK).
We did actively solicit speaker proposals through social media, through e-mail announcements with partner organizations, and so forth. The committee also invited noteworthy individuals to submit, and we made announcements at other industry events. Basically, looking for the best and brightest.
The initial review of proposals was blinded as to name and organization. It is difficult to do that entirely, because you see trademark phrases and styles in the proposal content that make it easy to guess, however I would say we worked hard NOT to guess. Where people recognized the content, or had close friends or associates with a proposal, they disclosed this and/or recused themselves from discussions.
I have to say that we didn’t really give gender a lot of consideration in discussions.
After an initial independent rating of each proposal by the committee members, any session rated below a cut-off was not given significant further consideration.
We DID give region/country quite a bit of consideration, as we wanted to have a truly global program, which we do. Since we had many more proposals of merit than we had speaking slots, we did not have to sacrifice anything to get this global mix.
In our final deliberations, we considered our collective knowledge of the individual’s skills at presenting, as well as how often we had seen them on a conference platform recently. We also tried to ensure that the same people are not on the podium every year, even if they are really good speakers, because they already get a lot of air time for their ideas.
So, I am pretty thrilled to see that gender does not appear to have been a factor in our deliberations.
Gender is clearly a factor in how people choose to engage with QRCA – our volunteers tend to skew female, and I think that chapter meeting attendance also skews female. I’m not sure about overall membership, and there is really no way to know about participation in the workforce, as there are a lot of people who do qualitative and other marketing research that are not members of any organization. My hypothesis is that conference speaking is a more appealing way for males to participate in the industry than volunteering is.
Insight and Innovation
The gender split in #MRX conferences: 2016 edition
Rating conferences on gender ratios is not easy. Though we may want every conference to be 50/50 male/female, it doesn’t always make sense.
- Not all industries are balanced on gender. For instance, qualitative researchers are much more likely to be female than male, and some regions in the world have very different employment rates for women and men.
- Men and women don’t necessarily submit at the same ratio. For instance, maybe 70% of the submissions were male and thus it makes sense that 70% of the speakers were male.
- Men and women don’t necessarily agree to speak at the same rate. A conference may offer equal numbers of acceptances to men and women but then it’s up to men and women to actually accept those offers. Conferences with 10 speakers can instantly drop from 50% female to 44% female if just one women declines the invitation.
- Normal variation means that sometimes a conference will have more men or more women. That’s just how numbers work and you can’t fault an organization because one time, one of their conferences wasn’t perfectly equal. But when ‘random’ variation across every conference is consistently in the same direction, you’ve got to wonder what’s happening behind the scenes.
Regardless, the best way to be aware of whether there may be gender issues is to actively measure reality. My methods aren’t perfect. I can’t always tell the gender of a speaker from their name and so I manually check names in LinkedIn and other times I leave that speaker out of the equation. I never know the submission rate by gender and so I can’t defend a conference that has few female speakers even if they had zero submissions from women. If you can correct my numbers, then I absolutely welcome your help. And, if you’ve been to a conference that I haven’t attended, do let me know the numbers and I’ll add them here.

TOTAL (Excluding AAPOR/WAPOR): 1845 men, 1096 women: 37% female
The Grades
A: Ratios between 47% and 50% – Huge round of applause for any conference that lands here!
- TTRA June (Colorado): 194 speakers, 78 men, 89 women (cannot identify gender of many names) = 53% female
- TMRE October (Florida): 126 speakers, 65 women, 61 men = 52% female
- TMRE Consumer Insights May (California): 12 men, 12 women, 50% female
- IIR Insight Tech: 22 speakers, 11 men, 11 women: 50% female
- AAPOR/WAPOR June (Austin): 1463 speakers, 718 men, 745 women = 49% Male (Yes, you read that correctly. 745 female speakers.)
- Quirk’s Event February (USA): 126 speakers, 64 women, 62 men = 49% Male
- LIMRA June (Florida): 39 speakers, 19 women, 20 men = 49% Female
- NewMR February (Global online): 27 Speakers, 14 women, 13 men = 48% Male
- MRIA June (Canada): 63 speakers, 33 men, 30 women = 48% Female
- EphMRA June (Frankfurt): 45 speakers, 24 men, 21 women = 47% female
- AIMRI Under30 February (New York): 9 speakers, 5 men, 4 women = 44% Female. Although this percentage doesn’t strictly belong here, with 9 speakers it can’t get any more equal.
B: Ratios from 42% and 46%
- MRS Health February (London): 26 speakers, 12 men, 14 women = 46% male
- PMRG May (USA): 37 speakers, 17 women, 20 men = 46% female
- IIR New Face: 22 speakers, 12 women, 10 men = 45% male
- Qual360 February (Berlin): 32 speakers, 14 women, 18 men = 44% female
- Media Insights February (Florida): 56 speakers, 24 women, 32 men = 43% female
- IIeX Health April (Philadelphia): 40 speakers, 17 women, 23 men = 43% female
- NEMRA May (Massachusetts): 14 speakers, 6 men, 8 women = 43% male
- ARF Audience Measurement: 58 speakers, 25 women, 33 men = 43% female
- NEMRA May (New England): 14 speakers, 6 men, 8 women = 43% male
- WCQR March : 43 speakers, 18 men, 25 women = 42% male. One of the conference organizers ran the numbers and determined that the ratio of submissions from men and women was the same as for speakers. You can read details about their speaker selection process here.
- MRA ISC May (New Orleans): 43 speakers, 18 women, 25 men = 42% female
- CASRO CRC, October: 72 speakers, 42 men, 30 women: 42% female
C: Ratios from 37% and 41%
- MAGHREB SUMMIT January (Casablanca): 17 speakers, 10 men, 7 women = 41% female
- MRS Travel March (London): 22 speakers, 13 women, 9 men = 41% male
- ESOMAR LATAM April (Bogota): 32 speakers, 13 women, 19 men = 41% female
- ESOMAR APAC May (Tokyo): 51 speakers, 20 women, 31 men = 39% female
- Omnishopper July (Chicago): 67 speakers, 41 men, 26 women: 39% female
- AMSRS September (Melbourne): 61 speakers, 37 men, 24 women: 39% female
- BHBIA May (London): 39 speakers, 24 men, 15 women: 38% female
D: Ratios from 32% and 36%
- MRS National March (London): 94 speakers, 34 women, 60 men = 36% female
- MENAP Forum March (Dubai): 25 speakers, 9 women, 16 men = 36% female
- ESOMAR congress September (New Orleans): 72 speakers, 26 women, 46 men = 36% female
- CASRO Tech (New York): 11 speakers, 7 men, 4 women: 36% female
- PMRC Europe October (Berlin): 25 speakers, 16 men, 9 women: 36% female
- Shopper Brain, June (Chicago): 23 speakers, 15 men, 8 women: 35% female
- OmniShopper International, November (London): 31 speakers, 20 men, 11 women: 35% female
- CXfusion April (Las Vegas): 53 speakers, 18 women, 35 men = 34% female
- ARF ReThink: 141 speakers, 48 women, 93 men = 34% female
- Febelmar Februrary (Brussels): 21 speakers, 14 men, 7 women = 33% female
- MRA CEO January (Florida): 12 speakers, 4 women, 8 men = 33% female
- Sentiment Analysis Symposium July (New York): 15 speakers, 5 women, 10 men = 33% female
- Shopper Brain Amsterdam (June): 21 speakers, 14 men, 7 women: 33% female
- IIeX NA June (Atlanta): 194 speakers, 63 women, 131 men: 32% female
F: Ratios <32%
- MRS Kids January (UK): 29 speakers, 20 women, 9 men = 31% male
- MRSI February (India): 35 speakers, 24 men, 11 women = 31% female
- IIeX Europe March (Amsterdam): 115 speakers, 36 women, 79 men = 31% female
- IIR Analytics: 42 speakers, 13 women, 29 men = 31% female
- ARF ReThink March: 140 speakers, 96 men, 44 women = 31% female
- MRMW Europe: 54 speakers, 37 men, 17 women: 31% female
- IIeX Latam: 68 speakers, 47 men, 21 women: 31% female
- MRweek: 32 speakers, 22 men, 10 women: 31% female
- MRIA QRC January (Toronto): 15 speakers, 11 women, 4 men = 27% male
- CASRO Digital March (Texas): 46 speakers, 14 women, 32 men = 30% female
- CX Fusion: 53 speakers, 35 men, 16 women: 30% female
- BVM Kongress April (Berlin): 28 speakers, 8 women, 20 men = 29% female
- Market Research Exchange, Florida (May): 41 speakers, 29 men, 12 women = 29% female
- AMA Analytics February (Arizona): 18 speakers, 5 women, 13 men = 28% female.
- NMWF April (Dubai): 36 speakers, 9 women, 27 men: 25% female
- Insight Show MW May (London): 123 speakers, 30 women, 93 men: 24% female
- CX week May: 25 speakers, 6 women, 19 men = 24% female
- MRMW APAC March (Malaysia): 39 speakers, 8 women, 31 men = 21% female
- ESOMAR Big Data: 27 speakers, 22 men, 5 women: 16% female
- Text Analytics Event April (Chicago): 19 speakers, 3 women, 16 men = 16% female
- SampleCon January (USA): 40 speakers, 6 women, 34 men = 15% female
- Predictive Analytics World April: 28 speakers, 4 women, 24 men = 14% female
Upcoming ratings: ESOMAR congress September, AMSRS congress September. (Please let me know of others.)
What can YOU do?
- Submit! You can’t complain if you don’t join the cause. Take the plunge and submit your first proposal ever this year! Make it easier for conference organizers to find you by taking the first step yourself.
- Encourage! Look to your left and look to your right. Have your neighbors submitted to a conference yet? Well, maybe right now is the perfect time to encourage them to just do it!
- Demand diversity! When you notice that conference speakers reflect a very narrow group of people, point it out and ask for more. Organizers want to give you want you want. But first, you need to tell them what you want. And, still, sometimes organizers don’t realize what is happening.
- Recommend! Remember that awesome speaker you saw at the last company meeting? At the last chapter event? Email your favourite organization and let them know you found a speaker for them. Organizers can’t ask them to speak if they don’t know who to ask.
What can conferences do?
- Look at submissions from a new point of view. Realize that people from different walks of life write differently and that some proposal styles may have greater appeal to you. Notice how much the writing style is affecting your choice of content and remove your style preferences from the equation. Recognize that some equally high quality proposals brag and exaggerate, while others are factual and modest.
- Ask sponsors to promote diversity. As conference organizers, only you know when the collection of speakers has veered away from a diverse group. Take a proactive approach and let sponsors know you care about representing the entire community. Ask sponsors to send great speakers who don’t fit into traditional boxes – really old, really young, differently abled, non-white, women.
- Ask for recommendations. Not just of the most popular speakers who know other popular speakers. Ask your fringe speakers about other awesome fringe speakers.
- Go to Twitter. There are tons of lists of women speakers and experts. My Lovestats account has several lists you can use. WIRe has a list a women speakers. Just ask.
- Share your numbers. When it turns out that one of your conferences seems skewed, let people know that the submissions were also skewed. It’s not necessarily a bad thing if 30% of your speakers were female if only 30% of your submissions came from women.
- Be the change we want to see. Even if your speaker ratio matches the submission ratio, if it’s not mostly equal, do something about it! Don’t wait for submissions. Hunt for awesome speakers who didn’t submit.
Demand that your conferences be Diversity Approved! (Tweet this post!)
Similar posts for other conferences
Related Posts
- Because it’s 2015: I challenge you to make your #MRX conference Diversity Approved
- The gender split in #MRX conferences: we’re not there yet – 2015
- The Presenter Gender Split #IIeXap14
- The Gender Bias Rears its Face #ESOMAR
- The Conference Presenter Gender Gap #WAPOR
- Gender bias among #AAPOR presenters
Because it’s 2015: I challenge you to make your #MRX conference Diversity Approved
Demand that your conferences be Diversity Approved! (Tweet this post!)
When Canada’s new Prime Minister, Justin Trudeau, was asked why his cabinet was 50% male and 50% female, his answer was simple. Because it’s 2015. Such a simple answer to a long standing problem.
As I look back over 2015, I see that “because it’s 2015” didn’t apply to every market research conference. Some conferences had speaker lists that were 70% male. Some conferences had speaker panels that were 100% male. No conferences had attendee lists nor industry lists that were 100% male let alone 70% male.
https://twitter.com/leftyjennyc/status/600279400869810176
There are many reasons that men might be over-represented as speakers, but few that are acceptable.
- Random chance. As a lover of statistics, I accept that random chance will create some all male panels. But since I’ve never seen an all female panel, random chance is not what’s at play here. If you’d rather see the math, Greg Martin calculated the chance of having all male speakers here. It’s not good.
- 70% or more of submissions were from men. That also is an acceptable reason. If women aren’t submitting, then they can’t be selected. So on that note, it’s up to you ladies to make sure you submit at every chance you get. And don’t tell me you’re not good enough to speak. I ranted on that excuse already.
- You haven’t heard of any women working in this area. This excuse is unacceptable. You can’t look for speakers only inside your own comfortable friend list. Get out of your box. Get online. There are tons of women talking about every conceivable industry issue. Find one woman and ask her for recommendations. You can start here: Data science, Marketing research, Statistics, Tech.
- The best proposals happen to be from men. This excuse is also unacceptable. It demonstrates that you believe men are better than women. You need to broaden your perception of what ‘better’ means. Men and women speak in different ways so you need to listen in different ways. It’s good for you. Try it.
- Women decline when we ask them to speak. It’s a real shame particularly if women decline invitations more often than men. But any time a woman declines, ask her for a list of people she recommends. And then consider the women on that list. No women in the list? Then specifically ask her if she knows any women.
- It’s a paid talk and they only sent men. Know what? It’s okay to remind companies that their panel isn’t representative of the industry. You can suggest that they send a broader range of people.
- We didn’t realize this was a problem. Inexcusable. Diversity has been an issue for years. People have been pointing this out to market research conferences for years. The right time to fix things is always now.
When was the last time you prepared a sampling matrix balanced on age, gender, and ethnicity and then were pleased when it was 70% female, 70% age 50+, and 90% white? Never, that’s when. You stayed in field and implemented appropriate sampling techniques until your demographics were representative. This is absolutely no different.
 So, to every conference organizer out there, ESOMAR, CASRO, MRA, MRIA, ARF, MRS, AMSRS, ESRA, AAPOR, I challenge you to review and correct your speaker list before announcing it.
- What percentage of submissions are from men versus women? Only when submissions are far from balanced is it acceptable for the acceptance list to be unbalanced.
- Are there any all male panels? Are there any all female panels? (By the way, all female panels talking about female issues do NOT count.)
- Are more than 55% of speakers male? Are more than 55% of speakers female?
- Is the invited speaker list well balanced? There is zero reason for invited speakers to NOT be representative.
- Did you actively ask companies to assist with ensuring that speakers were diverse?
If you can give appropriate answer to those questions, I invite you to publicly advertise your conference as Diversity Approved.
Will you accept this challenge for every conference you run in 2016? Will you:
- Post the gender ratio of submissions
- Post the gender ratio of acceptances
- Proudly advertise that your conference is “Diversity Approved”
Demand that your conferences be Diversity Approved! (Tweet this demand!)


