Panel: Public Opinion Quarterly Special – Survey research today and tomorrow #AAPOR #MRX #NewMR
Live note taking at #AAPOR in Austin, Texas. Any errors or bad jokes are my own.
Moderator: Peter V. Miller, U.S. Census Bureau
- He is accepting submissions of 400 words regarding these papers, to be published in an upcoming issue, due June 30, send to peter.miller@census.gov
Theory and Practice in Nonprobability Surveys:
Parallels Between Casual Inference and Survey Inference
Discussant: Jill DeMatteis, Westat
; Andrew Mercer, Pew Research Center; Frauke Kreuter, University of Maryland; Scott Keeter, Pew Research Center; Elizabeth Stuart, Johns Hopkins University
- Noncoverage – when people can’t be included in a survey
- Problem is when they are systematically based
- Selection bias is not as useful in a nonprobability sample as there is no sampling frame, and maybe not even a sample
- Need a more general framework
- Random selection and random treatment assignment is the best way to avoid bias
- Need exchangeability – know all the confounding, correlated variables
- Need positivity – everyone needs to be able to get any of the treatments, coverage error is a problem
- Need composition – everyone needs to be in the right proportions
- You might know the percent of people who want to vote one way, but then you also know you have more of a certain percentage of demographic in your group, but it’s never just one demographic group, it’s ten or twenty or 100 important demographic and psychographic variables that might have an association with the voting pattern
- You can’t weight a demographic group up [pay attention!]
- We like to assume we don’t have any of these three problems and you can never know if you’ve met them all, we hope random selection accomplishes this for us; or with quota selection we hope it is met by design
- One study was able to weight using census data a gigantic sample and the results worked out well [makes sense if your sample is so ridiculously large that you can put bigger weights on a sample of 50 000 young men]
- Using demographics and psychographics helps to create more accurate results, religion, political affiliation
- This needs to be done in probability and nonprobability samples
- You can never be certain you have met all the assumptions
- Think about confounding variables during survey design, not just demographics, tailored to the research question at hand
- Confounding is more important than math – it doesn’t matter what statistic you use, if you haven’t met the requirments first you’re in troubl
Apples to Oranges or Gala vs. Golden Delicious? Comparing Data Quality of Nonprobability Internet Samples to Low Response Rate Probability Samples
Discussant: George Terhanian, NPD Group
, David Dutwin, SSRS, Trent Buskirk, Marketing Systems Group
- S>80000, 9% response rate for probability sample [let’s be real here, you can’t have a probability sample with humans]
- The matching process is not fool proof, uses categorical match, matching coefficient, randomly selected when there was a tie
- Looked at absolute bias, standard deviation, and overal mean absolute bias
- Stuck with demographics variables, conditional variables, nested within gender, age, race or region
- Weighted version was good, but matched and raked was even closer, variability is much less with the extra care
- Nonprobability telephone surveys consistently had less variability in the errors
- Benchmarks are essential to know what the error actually is, you can’t just the bias without a benchmark
- You can be wrong, or VERY wrong and you won’t know you’re wrong
- Low response rate telephone gets you better data quality, much more likely you’re closer to truth
- Cost is a separate issue of course
- Remember fit for purpose – in politics you might need reasonably accurate point estimates
Audience discussion
- How do you weight polling research when political affiliation is part of both equations, what is the benchmark, you can’t use the same variables for weighting and measuring and benchmarking or you just creating the results you want to see
- If we look at the core demographics, maybe we’ve looked at something that was important [love that statement, “maybe” because really we use demographics as proxies of humanality]
- [if you CAN weight the data, should you? If you’re working with a small sample size, you just probably just get more sample. If you’re already dealing with tens of thousands, then go ahead and make those small weighting adjustments]

Evaluating polling accuracy #AAPOR #MRX
moderated by Mary McDougall, CfMC Survox Solutions
prezzie 1: midterm election polling in Georgia
- georgia has generally been getting more media attention because it is bluer than expected, change may be fast enough to outpace polls, population has changed a lot particularly around atlanta, georgia has become less white
- telephone survey using voter registration info, tested three weights – voter data, party targets, education weights
- registered voting weight was much better, education weighting was worse
- voter weight improvied estimates in georgia but you need voter information
- [why do presenters keep talking about need more research for reliability purposes, isn’t that default?]
prezzie #2: error in the 2014 preelection polls
- house effects – difference between one poll and every other poll, difference from industry average
- they aren’t what they used to be, used to be interview method and weight practices
- regression model is better than difference of means tests
- could it be whether the pollster is extremely active or if they only do it once in a while
- results show the more poll the more accurate you are, if you poll more in risky areas you are less accurate – but overall these results were kind of null
- second model using just many pollsters was much better – arkansas had a lot more error, it had the most pollsters
- in the end, cant really explain
prezzie #3: north carolina senate elections
- to use RDD or registration based sampling; will turn out be high or low; a small university has limited resources with highly talented competition
- chose RBS and did three polls, worked saturday to thursday, used live interviewers, screen for certain or probably will vote
- RBS worked well here, there were demographic gaps, big race gap, big party gaps
prezzie #4: opinion polls in referendums
- [seriously presenters, what’s with these slides that are paragraphs of text?]
- most polls are private and not often released, questions are all different, there is no incumbent being measured
- data here are 15 tobacco control elections and 126 questions in total, courts forced the polls to be public, find them on legacy library website
- five types of questions – uninformed heads up questions where you’re asked whether you agree or strongly agree [i.e., leading, biased, unethical questions. annie not happy!]
- predictions are better closer to the election, spending is a good predictor, city size is a good predictor
- using the word ‘strongly’ in the question doesn’t improve accuracy
- asking the question exactly as the ballot doesn’t improve the accuracy
- asking more questions from your side of the opinion doesn’t improve the accuracy
- polls often overestimate the winner’s percentage
- [these polls are great examples of abusing survey best practices research]
- post election surveys are accurate and useful for other purposes
- [big slam against appor for not promoting revealing of survey sponsors]
prezzie #5: comparing measures of accuracy
- big issue is opt-in surveys versus random sample [assuming random sampling of humans is possible!]
- accuracy affected by probability sampling, days to election, sample sizes, number of fielding days
- used elections in sweden with has eight parties in parliament, many traditional methods are inappropriate with multi-candidate elections
- sample size was good predictor, fielding days was not predictive, opt-in sample was worse but overall r square was very small
prezzie #6: polling third party candidates
- why do we care about these? don’t want to waste space on candidates who only get 1% of the votes
- 1500 data points, 121 organizations, 94 third party candidates – thank you to HuffPollster and DailyKos
- aggregate accuracy was good, most were overstatement, but there was systematic bias
- using the candidates names makes a difference, but if you name one candidate, you should name them all – i know i’m not voting for the top two candidates so i’m probably voting for this third party person you listed
- accuracy gets better closer to the date, sometimes you don’t know who the third party candidate is till close to the date
- live phone and IVR underestimate, internet overestimated
- there were important house effects – CBS/yougove underestimate; PPP overestimates; on average FOX news is fairly accurate with third party candidates
When does #AAPOR infuriate me? #MRX
Let me begin by saying I love AAPOR. I go to many conferences around the world and so can make some fair comparisons regarding the content and style of presentations. While AAPOR presentations are not known for skill in the physical presentation, AAPOR is top notch for its focus on methods and science. There is no fluff here. Give me content over decoration any day. I always recommend AAPOR conferences to my scientifically minded research friends. That said…
![]() Today i heard inferences that the difference between probability panels and nonprobability panels is quality. Are you kidding me? Since when does recruitment method translate into poor quality. Different isn’t bad. It’s different. I know first hand just how much work goes into building a quality panel. It ain’t easy to find and continually interest people in your (my) boring and tedious surveys. Fit for purpose is the issue here. Don’t use a data source for point estimates when it’s not suited for point estimates.
Today i heard inferences that the difference between probability panels and nonprobability panels is quality. Are you kidding me? Since when does recruitment method translate into poor quality. Different isn’t bad. It’s different. I know first hand just how much work goes into building a quality panel. It ain’t easy to find and continually interest people in your (my) boring and tedious surveys. Fit for purpose is the issue here. Don’t use a data source for point estimates when it’s not suited for point estimates.
And stop asking for response rates with nonprobability panels. High rates are not good and low rates are not bad. High response rates mean every person with a low response rate has been kicked off the panel. It does NOT mean you’re getting better representativity. Instead, ask about their data quality techniques. That’s what truly matters.
I heard today that a new paradigm is coming and AAPOR ought to lead it. Well, sadly, if AAPOR members still think response rates with panels are meaningful, nonprobability panels are worthless, and they’re still doing email subject line tests, oh my you’re in for a treat when you discover what eye-tracking is. AAPOR leading? Not even close. You’re meandering at the very end of an intensely competitive horse race.
Dear AAPOR, please enter the 21st century. Market researchers have been doing online surveys for twenty years. We finished our online/offline parallel tests ten years ago. We finished subject line testing ten years ago too. We’ve been doing big data for 50 years. We’ve been using social media data for 10 years. I could go on but there’s no need.
Where have you been all these years? Arguing that probability panels are the only valid method? That’s not good enough. Let me know when you’re open to learning from someone outside your bubble. Until then, I’ll be at the front of the horse race.
Concerning quality in opt-in panels #AAPOR #MRX
6 papers moderated by Martin Barron, NORC
prezzie 1: evaluting quality control questions, by Keith Phillips
- people become disengaged in a moment but not throughout an entire survey, true or false – these people are falsely accused [agree so much!]
- if most people fail a data quality question, its a bad question
- use a long paragraph and then state at the end please answer with none of the above to this engagement question – use a question that everyone can answer –> is there harm in removing these people
- no matter how a dataset is cleaned, the answers remained the same, they don’t hurt data quality, likely because it happens randomly
- people who fail many data quality questions are the problem, which questions are most effective?
- most effective questions were low incidence check, open ends, speeding
prezzie 2: key factor of opinion poll quality
- errors in political polling have doubled over the last ten years in canada
- telephone coverage has decreased to 67% when it used to be 95%
- online panel is highly advantageous for operational reasons but it has high coverage error and it depends on demographic characteristics
- online generated higher item selection than IVR/telephone
prezzie 3: new technology for global population insights
- random domain intercept technology – samples people who land on 404 pages, reaches non-panel people
- similar to random digit dialing
- allows access to many countries around the world
- skews male, skews younger, but that is the nature of the internet
- rr in usa are 6% compared to up to 29% elsewhere [wait until we train them with our bad surveys. the rates will come down!]
- 30% mobile in USA but this is competely different around the world
- large majority of people have never or rarely take surveys, very different than panel
prezzie 5: surveys based on incomplete sampling
- first mention of total survey error [its a splendid thing isn’t it!]
- nonprobability samples are more likely to be early adopters [no surprise, people who want to get in with new tech want to get in with other things too]
- demographic weighting is insufficient
- how else are nonprobability samples different – more social engagement, higher self importance, more shopping behaviours, happier in life, feel like part of the community, more internet usage
- can use a subset of questions to help reduce bias – 60 measures reduced to number surveys per month, hours on internet, trying new products first, time spent watching TV, using coupons, number of times moved in last 5 years
- calibrated research results matched census data well
- probability sampling is always preferred but we can compensate greatly
prezzie 6: evaluating questionnaire biases across online sample providers
- calculated the absolute difference possible when completing rewriting a survey in every possible way – same topic but different orders, words, answer options, answer order, imagery, not using a dont know
- for example, do you like turtles vs do you like cool turtles
- probability panel did the best, crowd sourced was second best, opt in panel and river and app clustered together at the worst
- conclusions – more research is needed [shocker!]
Stop Asking for Margin of Error in Polling Research
Originally published on Huffington Post. Also published on Linkedin, Quora, and anywhere else I have an account.
Just a few days ago, I moderated a webinar with four leading researchers and statisticians to discuss the use of margin of error with non-probability samples. To a lot of people, that sounds like a pretty boring topic. Really, who wants to listen to 45 minutes of people arguing about the appropriateness of a statistic?
Who, you ask? Well, more than 600 marketing researchers, social researchers, and pollsters registered for that webinar. That’s as many people who would attend a large conference about far more exciting things like using Oculus Rift and the Apple Watch for marketing research purposes. What this tells me is that there is a lot of quiet grumbling going on.
I didn’t realize how contentious the issue was until I started looking for panelists. My goal was to include 4 or 5 very senior level statisticians with extensive experience using margin of error on either the academic or business side. As I approached great candidate after great candidate, a theme quickly arose among those who weren’t already booked for the same time-slot – the issue was too contentious to discuss in such a public forum. Clearly, this was a topic that had to be brought out into the open.
The margin of error was designed to be used when generalizing results from probability samples to the population. The point of contention is that a large proportion of marketing research, and even polling research, is not conducted with probability samples. Probability samples are theoretical – it is generally impossible to create a sampling frame that includes every single member of a population and it is impossible to force every randomly selected person to participate. Beyond that, the volume of non-sampling errors that are guaranteed to enter the process, from poorly designed questions to overly lengthy complicated surveys to poorly trained interviewers, mean that non-sampling errors could have an even greater negative impact than sampling errors do.
Any reasonably competent statistician can calculate the margin of error with numerous decimal places and attach it to any study. But that doesn’t make it right. That doesn’t make the study more valid. That doesn’t eliminate the potentially misleading effects of leading questions and skip logic errors. The margin of error, a single number, has erroneously come to embody the entire system and processes related to the quality of a study. Which it cannot do.
In spite of these issues, the media continue to demand that Margin of Error be reported. Even when it’s inappropriate and even when it’s insufficient. So to the media, I make this simple request.
Stop insisting that polling and marketing research results include the margin of error.
Sometimes, the best measure of the quality of research is how transparent your vendor is when they describe their research methodology, and the strengths and weaknesses associated with it.
Related articles


Daddy, where do statistics come from? #MRX
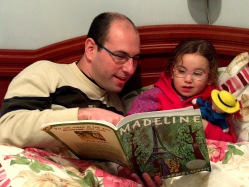 Well, my little one, if you insist. Just one more bedtime story.
A long, long time ago, a bunch of people who really loved weather and biology and space and other areas of natural science noticed a lot of patterns on earth and in space. They created neato datasets about the weather, about the rising and setting of the sun, and about how long people lived. They added new points to their datasets everyday because the planets always revolved and the cells always went in the petri dish and the clouds could always be observed. All this happened even when the scientists were tired or hungry or angry. The planets moved and the cells divided and the clouds rained because they didn’t care that they were being watched or measured. And, the rulers and scales worked the same whether they were made of wood or plastic or titanium.
Over time, the scientists came up with really neat equations to figure out things like how often certain natural and biological events happened and how often their predictions based on those data were right and wrong. They predicted when the sun would rise depending on the time of year, when the cells would divide depending on the moisture and oxygen, and when the clouds would rain depending on where the lakes and mountains were. This, my little curious one, is where p-values and probability sampling and t-tests and type 1 errors came from.
The scientists realized that using these statistical equations allowed them to gather small datasets and generalize their learnings to much larger datasets. They learned how small a sample could be or how large a sample had to be in order to feel more confident that the universe wasn’t just playing tricks on them. Scientists grew to love those equations and the equations became second nature to them.


It was an age of joy and excitement and perfect scientific test-control conditions. The natural sciences provided the perfect laboratory for the field of statistics. Scientists could replicate any test, any number of times, and adjust or observe any variable in any manner they wished. You see, cells from an animal or plant on one side of the country looked pretty much like cells from the the same animal or plant on the other side of the county. It was an age of probability sampling from perfectly controlled, baseline, factory bottled water.
In fact, statistics became so well loved and popular that scientists in all sorts of fields tried using them. Psychologists and sociologists and anthropologists and market researchers started using statistics to evaluate the thoughts and feelings of biological creatures, mostly human beings. Of course, thoughts and feelings don’t naturally lend themselves to being expressed as precise numbers and measurements. And, thoughts and feelings that are often not understood and are often misunderstood by the holder. And, thoughts and feelings aren’t biologically determined, reliable units. And worst of all, the measurements changed depending on whether the rulers and scales were made of English or Spanish, paper or metal, or human or computer.


Sadly, these new users of statistics grew to love the statistical equations so much that they decided to ignore that the statistics were developed using bottled water. They applied statistics that had been developed using reliable natural occurrences to unreliable intangible occurrences. But they didn’t change any of the basic statistical assumptions. They didn’t redo all the fundamental research to incorporate the unknown, vastly greater degree of random and non-randomness that came with measuring unstable, influenceable creatures. They applied their beloved statistics to pond water, lake water, and ocean water. But treated the results as though it came from bottled water.
 So you see, my dear, we all know where statistics in the biological sciences come from. The origin of probability sampling and p-values and margins of error is a wonderful story that biologists and chemists and surgeons can tell their little children.
One day, too, perhaps psychologists and market researchers will have a similar story about the origin of psychological statistics methods to tell their little ones.
The end.
A Model-Based Approach for Achieving a Representative Sample by George Terhanian #CASRO #MRX
Live blogging from the CASRO Digital conference in San Antonio, Texas. Any errors or bad jokes are my own.
“A Model-Based Approach for Achieving a Representative Sample”
 Although the enterprise of online research (with non-probability samples) has witnessed remarkable growth worldwide since its inception about 15 years ago, the US public opinion research community has not yet embraced it, partly because of concerns over data reliability and validity. The aim of this project is to rely on data from a recent, large-scale ARF study to develop an optimal model for achieving a representative sample. By that, we mean one that reduces or eliminates the bias associated with non-probability sampling. In addition to the presenter, this paper was authored byJohn Bremer, (Toluna) and Carol Haney (Toluna).
- George Terhanian, Group Chief Strategy & Products Officer ,Toluna
- The key is representativeness. This topic is not new, we talked about it 15 years ago. Criticisms are not new – Warren Mitofksy said the willingness to discard sampling frames and feeble attempts at manipulating the resulting bias undermines the credibility of the research process
- SLOP – Self, selected, opinion, panel. [Funny!]
- Growth of online research remains strong as it has since the beginning.
- 2011 – AAPOR needs to promote flexibility not dogmatism, established a task force on non-probability methods. Identified sample matching as most promising non-probability approach. Did not offer next steps or an agenda.
- Study with 17 different companies in FOQ study

- Researchers should use the ARF’s FOQ2 data to test on-probability sampling and representativeness
- Used a multi-directional search algorithm (MSA)
- Bias is difference between what respondents report and what we know to be true. e.g., Do you smoke? Benchmark vs panel scores.
- Reduce bias through 1) respondent selection or sampling and 2) post hoc adjustment or weighting [I always prefer sampling]
- FOQ2 suggests weighting needs to include additional variables such as demographics, secondary demographics (household characteristics), behaviours, attitudes
- [If you read my previous post on the four types of conference presenters, this one is definitely a content guru 🙂 ]
- Using only optimal demographics, panel and river sample were reasonably good, reduced bias by 20 to 25%. Time spent online helps to reduce bias and is a proxy for availability in terms of how often they take surveys
- Ten key variables are age gender region, time spent online, race, education [sorry, missed the rest]
- Other variables like feeling hopeful, , concern about privacy of online information were top variables [sorry, missed again, you really need to get the slides!]
- Need to sample on all of these but don’t need to weight on all of them
- [I’m wondering if they used a hold-back sample and whether these results are replicable, the fun of step-wise work is that random chance makes weird things happen]
Other Posts
Have we been doing control groups all wrong? #MRX
Every time we test a new subject line, a new survey question, a new image, a new way-cool-and-so-much-better alternative, we always use a control group. That way, when we see the results from the test group, we can immediately see whether it was better, worse, or the same as the way we usually do things.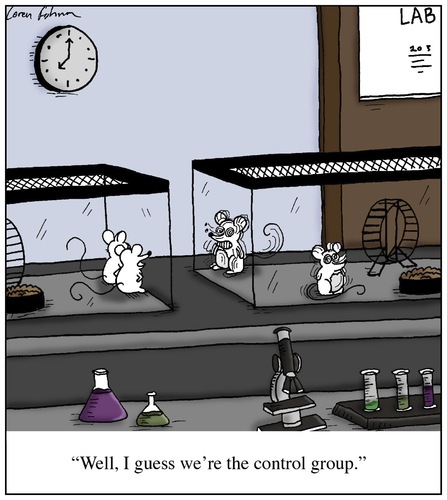
But let’s take a step back for a minute and remember how “random” sampling and probability works. Statistics tell us that even superior quality research designs are plagued by random chance occurences. That’s why when we report numbers, we always put a confidence interval around them, say 3 or 4 points. And then on top of that, we have to remember that five per cent of the time, the number we see will be horribly different from reality. Sadly, we can never know whether the number we’ve found is a few points away from reality or 45 points away from reality.
The only way to know for sure, or at least, nearly for sure, is to re-run the test 19 times. To hit the 20 times that allow us to say “19 times out of 20.”
And yet, we only ever use one single control group before declaring our test group a winner, or loser. One control group that could be wrong by 3 points or 43 points.
So here’s my suggestion. Enough with the control group. Don’t use a control group anymore. Instead, use control groups. Yes, plural. Use two control groups. Instead of waiting a week and redoing the test again, which we all know you haven’t got the patience for, do two separate control groups. Launch the control survey twice using two completely separate and identical processes. Not a split-test or hold-back sample. Build the survey. Copy it. Launch full sample to both surveys.
Now you will have a better idea of the kind of variation to expect with your control group. Now you will have a better idea of how truly different your test group is.
No, it’s not 19 repetitions by 19 different researchers in 19 different countries with 19 different surveys but it’s certainly better than assuming your control group is the exact measure of reality.
Other Posts
Probability and Non-Probability Samples in Internet Surveys #AAPOR #MRX
 … Live blogging from beautiful Boston, any errors are my own…
Probability and Non-Probability Samples in Internet Surveys
Moderator: Brad Larson
Understanding Bias in Probability and Non-Probability Samples of a Rare Population John Boyle, ICF International
- If everything was equal, we would choose a probability sample. But everything is not always equal. Cost and speed are completely different. This can be critical to the objective of the survey.
- Did an influenza vaccination study with pregnant women. Would required 1200 women if you wanted to look at minority samples. Not happening. Influenza data isn’t available at a whim’s notice and women aren’t pregnant at your convenience. Non-probability sample is pretty much the only alternative.
- Most telephone surveys are landline only for cost reasons. RDD has coverage issues. It’s a probability sample but it still has issues.
- Unweighted survey looked quite similar to census data. Looked good when crossed by age as well. Landline are more likely to be older and cell phone only are more likely to be younger. Landline more likely to be married, own a home, be employed, higher income, have insurance from employer.
- Landline vs cell only – no difference on tetanus shot, having a fever. Big differences by flu vaccination though.
- There are no gold standards for this measure, there are mode effects,
- Want probability samples but can’t always achieve them
A Comparison of Results from Dual Frame RDD Telephone Surveys and Google Consumer Surveys
- PEW and Google partnered on this study; 2 question survey
- Consider fit for purpose – can you use it for trends over time, quick reactions, pretesting questions, open-end testing, question format tests
- Not always interested in point estimates but better understanding
- RDD vs Google surveys – average different 6.5 percentage points, distribution closer to zero but there were a number that were quite different
- Demographics were quite similar, google samples were a bit more male, google had fewer younger people, google was much better educated
- Correlations of age and “i always vote” was very high, good correlation of age and “prefer smaller government”
- Political partisanship was very similar, similar for a number of generic opinions – earth is warming, same sex marriage, always vote, school teaching subjects
- Difficult to predict when point estimates will line up to telephone surveys
A Comparison of a Mailed-in Probability Sample Survey and a Non-Probability Internet Panel Survey for Assessing Self-Reported Influenza Vaccination Levels Among Pregnant Women
- Panel survey via email invite, weighted data by census, region, age groups
- Mail survey was a sampling frame of birth certificates, weighted on nonresponse, non-coerage
- Tested demographics and flu behaviours of the two methods
- age distributions were similar [they don’t present margin of error on panel data]
- panel survey had more older people, more education
- Estimates differed on flu vaccine rates, some very small, some larger
- Two methods are generally comparable, no stat testing due to non-prob sample
- Trends of the two methods were similar
- Ppanel survey is good for timely results
Probability vs. Non-Probability Samples: A Comparison of Five Surveys
- [what is a probability panel? i have a really hard time believing this]
- Novus and TNS Sifo considered probability
- YouGov and Cint considered non-probability
- Response rates range from 24% to 59%
- SOM institute (mail), Detector (phone), LORe (web) – random population sample, rates from 8% to 53%
- Data from Sweden
- On average, three methods differ from census results by 4% to 7%, web was worst; demos similar expect education where higher educated were over-represented, driving licence over-rep
- Non-prob samples were more accurate on demographics compared ot prob samples; when they are weighted they are all the same on demographics but education is still a problem
- The five data sources were very similar on a number of different measures, whether prob or non-prob
- demographic accuracy of non-prob panels was better. also closer to political atittudes. No evidence that self recruited panels are worse.
- Need to test more indicators, retest
Modeling a Probability Sample? An Evaluation of Sample Matching for an Internet Measurement Panel
- “construct” a panel that best matches the characteristics of a probability sample
- Select – Match – Measure
- Matched on age, gender, education, race, time online, also looked at income, employment, ethnicity
- Got good correlations and estimates from prob and non-prob.
- Sample matching works quite well [BOX PLOTS!!! i love box plots, so good in so many ways!]
- Non-prob panel has more heavy internet users
Related articles
- Thoughts on the CMRP designation #MRX #NewMR (mriablog.wordpress.com)
- Minimizing Nonresponse Bias (GREAT session) #AAPOR #MRX (lovestats.wordpress.com)
- The Roles of Blogs in Public Opinion Research Dissemination #AAPOR #MRX (lovestats.wordpress.com)
- AAPOR Women Leaders Share Their Insights #AAPOR #MRX (lovestats.wordpress.com)
Do Google Surveys use Probability Sampling? #MRX #MRMW
When Google announced their survey capabilities, the market research space was abuzz with anticipation. Oh, the possibilities! Clients, of course, were eager to learn about a new option that might be better and cheaper than what market research organizations have to offer. On the other hand, market researchers wondered if they ought to be fearful of the competition. Whichever side of the fence you’re on, it was clear that when Google spoke at MRMW, the room would be full.
https://twitter.com/LoveStats/status/225697789198364672
Paul McDonald, the Google rep, shared lots of great information about the tool and the audience was genuinely impressed. How could you not be impressed with the smooth and clean design and the quick responses.
But we’re market researchers. We know (or we should know) about statistics and probability sampling and what makes good quality data. So it puzzled me when I saw margin of error reported on their survey results. Margin of error shouldn’t be reported on non-probability samples.
https://twitter.com/LoveStats/status/225972551699013633
During the break, I asked the person manning the Google demo table about the reason for reporting margin of error. But alas, no answer for me.
https://twitter.com/LoveStats/status/226346795767320576
However, Google is monitoring the MRMW tweets for they provided this answer to me.
https://twitter.com/Google_Surveys/status/227525864324210689
Unfortunately, “stratified sampling according to census rep” has nothing to do with probability sampling. Margin of error can only be reported on probability samples whereby all people have an equal and independent chance of being selected for inclusion. So, if Google wants to report margin of error, then they must insist that their research results only be generalized to people who use Google, people who use the websites on which Google displays the surveys, and people who don’t use ad-block (I’m guessing). There are probably some other conditions in there but I’m obviously not familiar with the technicalities of how Google does their research. Regardless, as soon as you stray from the very basic conditions, you have fallen into convenience sampling territory and margin of error is no longer appropriate to display.
Google has kindly prepared a white paper (Comparing Google Consumer Surveys to Existing Probability and Non-Probability Based Internet Surveys) for those of us interested in the details of their product. I enjoyed reading all the criteria that explained why Google surveys don’t use probability sampling. Do read the white paper as you’ll probably be impressed with the results regardless. And keep in mind that survey panels can’t provide probability samples. Even though someone claimed that’s what they gave Google.
But really, who CARES if it’s a probability sample? 99.9%(a) of all market research does not use probability samples and we get along pretty well. Market researchers understand the issues of not using probability sampling, they understand how to interpret and analyze non-probability results, they know how to create clear and unbiased market research, etc. It’s not that we want probability samples. It’s that we want the smarts to tell us when our non-probability samples aren’t good enough.
I’ll let you know if Google follows up…
Postscript: A google rep and I are in the midst of emails about what type of data warrants use of the margin of error. I’ve been sent this link. If you’re statistically inclined, do have a read. ftp://ftp.eia.doe.gov/electricity/mbsii.pdf
Footnote
(a) I totally made up that number. I have no clue what percentage of market research uses probability sampling. But since most of us use survey panels, focus groups, mall intercepts, mobile surveys etc you get my point.
Related articles
- Google surveys, and oh, some other people too #MRMW #MRX (lovestats.wordpress.com)
- The Top 10 Things We Love About Social Media Research #MRX (lovestats.wordpress.com)
- I hate social media research because: It’s not a rep sample #2 #MRX (lovestats.wordpress.com)
- What Market Research in the Mobile World means to me #MRX #MRMW (lovestats.wordpress.com)


