I’m an individual market researcher in Canada: Which association should I join?
What’s up Canadian researchers! In recent weeks…
- CRIC set out a statement of purpose and polices to help market research companies in Canada.
- ESOMAR announced a partnership with CRIC to help individual researchers whose company’s are members of CRIC.
But what about students, academics, government employees, freelancers like me, and all the individual researchers from Canadian companies that aren’t members of CRIC? Where do these people turn?
Fortunately, I’ve helped provide a Canadian perspective to a lot of really great organizations over the years including:
- ISO: I’ve been the Canadian Chair of the International Standards Association, TC 225: Market, Opinion, and Social Research committee since 2014
- Insights Association: I was part of the MRA Research Advisory Board (2016), and worked on the MRA/IMRO Guide to the Top 16 Social Media Research Questions (2010)
- ESOMAR: I helped with the ESOMAR/GRBN Guideline on Social Media Research (2017), ESOMAR 24 Questions for Social Media Research (2010), ESOMAR Guide to Market Research (2016)
- AAPOR: I helped AAPOR with the planning group for council on diversity (2016), national conference planning (2018), board nominations (2015), conference code of conduct (2017)
In other words, I’ve seen first hand that these associations have decades of experience in promoting high quality standards and ethics in our industry and have been longtime supporters of the Canadian industry as well.
You will be extremely well served as an individual member of one of these four associations.
- AAPOR: If you’re an academic, polling geek, or into social and political research, this is a great association for you. Even better, their annual conference will be in Toronto this May. I’m helping them organize the chapter event!
- ESOMAR: If you conduct research around the world or want to stay in touch with what’s new and amazing in countries beyond our borders, look no further. Esomar is a great choice for you even if your company is not a member of CRIC.
- Insights Association: If much of your work is conducted in North America, why not say a howdy hello to our neighbours to the south sharing the same time zone as us!
- QRCA: Oh quallies, you’ve built something amazing here. If you’re a quallie and not already a member, correct that mistake post haste!
There are, of course, other options. But before jumping into one, do your homework. Make sure the association and association leaders you choose have a solid foundation and proven track record of promoting high standards and ethical behaviours, and are viewed as gold-standard providers by our industry leaders.
If you aren’t sure which association is right for you, talk to several of your clients or research providers. Find out which associations they know and trust. And if you’re still stuck, I’d be happy to help you out. Send me a quick message.
[Side note: MRIA-TT progress is slow. We don’t yet have an option to add to the above list.]
Eye Tracking in Survey Research #AAPOR
Moderator: Aaron Maitland, Westat; Discussant: Jennifer Romano Bergstrom, Facebook
Evaluating Grid Questions for 4th Graders; Aaron Maitland, Westat
- Used to study cognitive processing
- Does processing of questions change over the survey period
- 15 items, 5 content areas about learning, school, tech in school, self-esteem
- 15 single items and 9 grid items
- Grid questions are not more difficult, only first grid takes extra consideration//fixation
- Double negatives have much longer fixation, so did difficult words
- Expressed no preference for one type of question


Use of Eye-tracking to Measure Response Burden; Ting Yan, Westat Douglas Williams, Westat
- Normally consider length of interview, or number of questions or page; but these aren’t really burden
- Attitudes are a second option, interest, importance, but that’s also not burden; Could ask people if they are tired or bored
- Pupil dilation is a potential measure, check while they recall from memory, pay close attention, thinking hard, these things are small and involuntary; related to memory load
- 20 participants, 8 minute survey, 34 target questions, attitude and behavioural questions, some hard or easy
- Asked self reported burden on 4 items – how hard is this items, how much effort did it take to answer this
- Measured pupil diameter at each fixation, base diameters differ by person, they used dilation instead, used over a base measure, percentage over a base, average dilation and peak dilation
- Dilation greater for hard questions, peak 50% larger for hard questions, statistically significant though raw number seems very small
- Could see breakoffs on the questions with more dilation
- Sometimes not consistent with breakoffs
- Self report did correlate with dilation
- Can see people fixate on question many times and go back and forth from question to answer
- Question stems caused more fixation for hard questions
- Eye tracking removes bias of self report, more robust
- Can we use this to identify people who are experiencing too much burden [imagine using this during an interview, you could find out which candidates were having difficult answering questions]


The Effects of Pictorial vs. Verbal Examples on Survey Responses; Hanyu Sun, Westat; Jonas Bertling, Educational Testing Service Debby Almonte, Educational Testing Service
- Survey about food, asked people how much they eat of each item
- Shows visual or verbal examples
- Measured mean fixation
- Mean fixation higher for pictorial in all cases, more time on pictures than the task, Think it’s harder when people see the pictures [i’d suggest the picture created a limiting view of the product rather than a general view of ‘butter’ which makes interpretations more difficult]
- No differences in the answers
- Fixation times suggests a learning curve for the questions, easier over time
- Pictorial requires more effort to respond

Respondent Processing of Rating Scales and the Scale Direction Effect; Andrew Caporaso, Westat
- Some people suggest never using a vertical scale
- Fixation – is pausing
- Saccades – is the rapid movement between pausing
- Respondents don’t always want to tell you they’re having trouble
- 34 questions, random assignment of scale direction
- Scale directions didn’t matter much at all
- There may be a small primacy effect with a longer scale, lower education may be more susceptible
- Fixations decreased over time
- Top of scale gets most attention, bottom gets the least [so, people figuring out what the scale it, you don’t need to read all five options once you know what the first one particuarly for an agreement scale. Where people can guess all the answers from the first answer. ]


Question Order, Question Length, And Question Context #AAPOR
Moderator: Jessica L. Holzberg, U.S. Census Bureau
Satisfied or Dissatisfied? Does Order Matter?; Jolene D. Smyth, University of Nebraska-Lincoln Richard Hull, University of Nebraska-Lincoln
- Best practice is to use a balanced question stem and keep response options in order
- What order should it be in the question stem
- Doesn’t seem to matter whether the scale is left to right or top to bottom
- Visual Heurstic Theory – help make sense of questions, “left and top mean first” and “up means good”, people expect the positive answer to come first, maybe it’s harder to answer if good is a the bottom
- Why should the question stem matter, we rarely look at this
- “How satisfied or dissatisfied are you? [I avoid this completely by saying what is your opinion about this and then use those words in the scale, why duplicate words and lengthen questions]
- Tested Sat first and Disat second in the stem, and then Sat top and Disat bottom in the answer list, and vice versa
- What would the non repsonse look like in these four options – zero differences
- Order in question stem had practically no impact, zero if you think about random chance
- Did find that you get more positive answers when positive answer is first
- [i think we overthink this. If the question and answers are short and simple, people change no trouble and random chance takes its course. Also, as long as all your comparisons are within the test, it won’t affect your conclusions]
- [She just presented negative results. No one would ever do that in a market research conference 🙂 ]
Question Context Effects on Subjective Well-being Measures; Sunghee Lee, University of Michigan Colleen McClain, University of Michigan
- External effects – weather, uncomfortable chair, noise in the room
- Internal effects – survey topic, image, instructions, response sale, question order
- People don’t view questions in isolation, it’s a flow of questions
- Tested with life satisfaction and self-rated health, how are the two related, does it matter which one you ask first; how will thinking about my health satisfaction affect my rating of life satisfaction
- People change their behaviors when they are asked to think about mortality issues, how is it different for people whose parents are alive or deceased
- High correlations in direction as expected
- When primed, people whose parents are deceased expected a lesser lifespan
- Primed respondents said they considered their parents death and age at death
- Recommend keeping the questions apart to minimize effects [but this is often/rarely possible]
- Sometimes priming could be a good thing, make people think about the topic before answering
Instructions in Self-administered Survey Questions: Do They Improve Data Quality or Just Make the Questionnaire Longer?
Cleo Redline, National Center for Education Statistics Andrew Zukerberg, National Center for Education Statistics Chelsea Owens, National Center for Education Statistics Amy Ho, National Center for Education Statistics
- For instance, if you say “how many shoes do you have not including sneakers”, and what if you have to define loafers
- Instructions are burdensome and confusing, and they lengthen the questionnaire
- Does formatting of instructions matter
- Put instructions in italics, put them in bullet points because there were several somewhat lengthy instructions
- Created instructions that conflicted with natural interpretation of questions, eg assessment does not include quits or standardized tests
- Tried using paragraph or list, before or after, with or without instructions
- Adding instructions did not change mean responses
- Instructions intended to affect the results did actually do so, I.e., people read and interpreted the instructions
- Instructions before the question are effective as a paragraph
- Instructions after the question are more effective as lists
- On average, instructions did not improve data question, problems are real bu they are small
- Don’t spend a lot of time on it if there aren’t obvious gains
- Consider not using instructions
Investigating Measurement Error through Survey Question Placement; Ashley R. Wilson, RTI International Jennifer Wine, RTI International Natasha Janson, RTI International John Conzelmann, RTI International Emilia Peytcheva, RTI International
- Generally pool results from self administered and CATI results, but what about sensitive items, social desirability, open end questions, what is “truth”
- Can evaluate error with fictitious issues – e.g., a policy that doesn’t exist [but keep in mind policy names sound the same and could be legitimately misconstrued ]
- Test using reverse coded items, straight lining, check consistency of seeming contradictory items [of course, there are many cases where what SEEMS to contradict is actually correct, e.g., Yes, I have a dog, No I don’t buy dog food; this is one of the weakest data quality checks]
- Can also check against administrative data
- “AssistNow” loan program did not exist [I can see people saying they agree becuase they think any loan program is a good thing]
- On the phone, there were more substantive answers on the phone, more people agreed with the fictitious program [but it’s a very problematic questions to begin with]
- Checked how much money they borrowed, $1000 average measurement error [that seems pretty small to me, borrow $9000 vs $10000 is a non-issue, even less important at $49000 and $50000]
- Mode effects aren’t that big
Do Faster Respondents Give Better Answers? Analyzing Response Time in Various Question Scales; Daniel Goldstein, NYC Department of Housing Preservation and Development; Kristie Lucking, NYC Department of Housing Preservation and Development; Jack Jerome, NYC Department of Housing Preservation and Development; Madeleine Parker, NYC Department of Housing Preservation and Development; Anne Martin, National Center for Children and Families
- 300 questions, complicated sections, administered by two interviewers, housing, finances, debt, health, safety, demographics; Variety of scales throughout
- 96000 response times measured, left skewed with a really long tail
- Less education take longer to answer questions, people who are employed take longer to answer, older people take longer to answer, and none glish speakers take the longest to answer
- People answer more quickly as they go through the survey, become more familiar with how the survey works
- Yes no are the fastest, check all that apply are next fast as they are viewed as yes no questions
- Experienced interviewers are faster
- Scales with more answer categories take longer

Conference Speakers Wearing Heart Rate FitBits at #AAPOR #Wearables
Everyone says they get nervous when they speak but how do you know who’s just saying it and who actually is nervous? Well, welcome to Fitbit. Ever since I got my Fitbit, I could easily tell from the heartrate monitor exactly what was happening in my life. Three days before a conference, my heartrate would start increasing. Once I arrived, my sleep was disrupted. And when I actually spoke, my heartrate went nuts.
Today, Josh put his Fitbit chart online so I figured, ah, what the heck, I can do that that too. And when I asked for more volunteers, Jessica offered hers as well. Feel free to send YOUR heartrate chart to me and I’ll add it here. Enjoy!
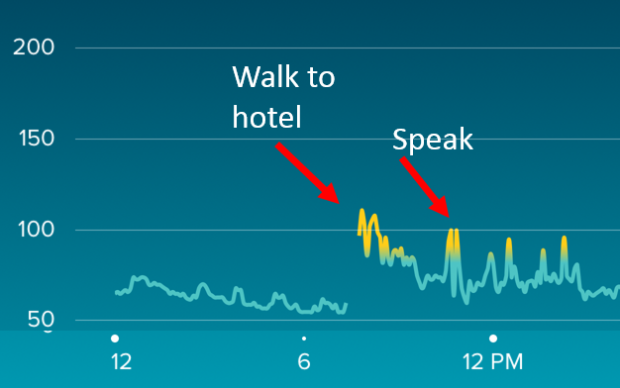
Annie / @LoveStats. My 25 minute walk to the hotel started with a high heartrate and then leveled off as I settled in at the hotel. But as soon as it was my turn to present, you’d think I was out jogging again!
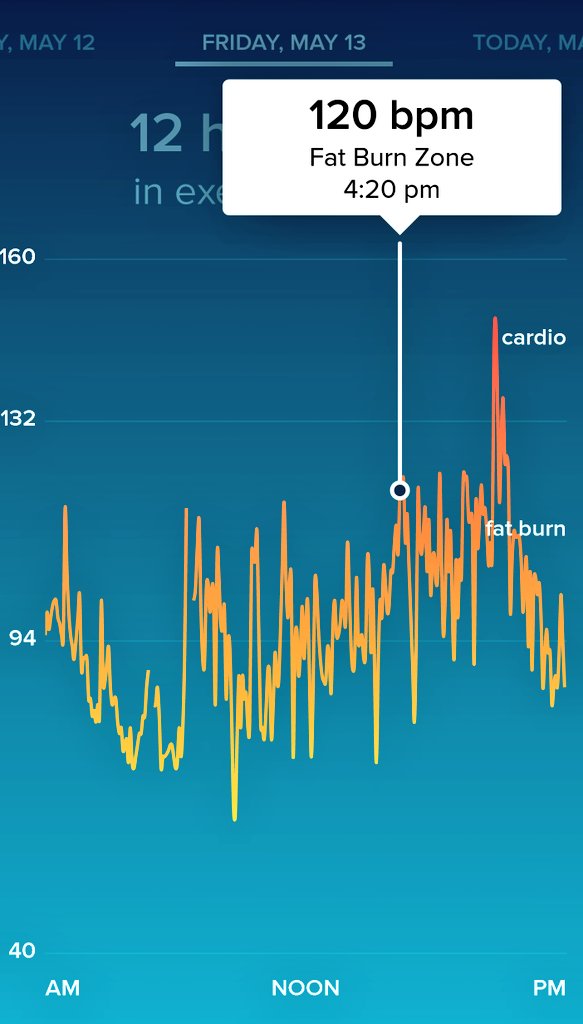
Josh De La Rosa / @JoshDelaRosa1. Lovely peak when Josh spoke which almost instantly dropped as soon as he finished speaking.
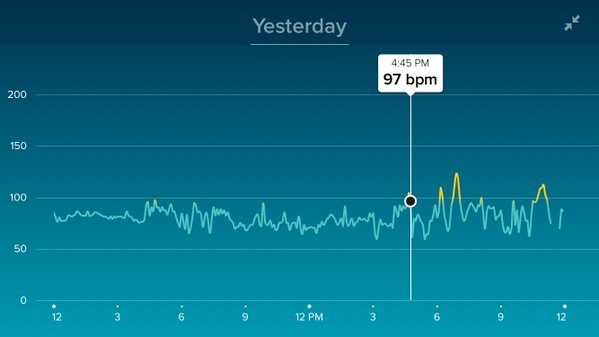
Jessica Holzberg / @jlholzberg “apparently my evening out got my heart rate up more than my pre-presentation jitters :)”
The Mechanics of Election Polls #AAPOR
Live note taking at #AAPOR in Austin Texas. Any errors or bad jokes are my own.
Moderator: Lisa Drew, two.42.solutions
RAND 2016 Presidential Poll Baseline Data – PEPS; Michael S. Pollard, RAND Corporation Joshua Mendelsohn, RAND Corporation Alerk Amin, RAND Corporation
- RAND is nonprofit private company
- 3000 people followed at six points throughout the election, starting with a full baseline survey in December, before candidates really had an effect, opinions of political issues, of potential candidates, attitudes towards a range of demographic groups, political affiliation and prior voting, a short personality questionnaire
- Continuously in field at first debate
- RDD but recruited RDD and then offered laptops or Internet service if needed
- Asked people to say their chance of voting, and of voting for democrat, republican, someone else, out of 100%
- Probabilistic polling gives an idea of where people might vote
- In 2012 it was one of the most accurate popular vote systems
- Many responders a have been surveyed since 2006 providing detailed profiles and behaviors
- All RAND data is publicly available unless it’s embargoed
- Rated themselves and politicians on a liberal to conservative scale
- Perceptions of candidates have chanced, Clinton, Cruz, and average democrat more conservative now, trump more liberal now; sanders, kasich, average republican didn’t move at all
- Trump supporters more economically progressive than Cruz supporters
- Trump supporters concerned about immigrants and support tax increases for rich
- If they feel people like me don’t have a say in government, they are more likely to support trump
- Sanders now rates higher than Clinton on “cares about people like me”
- March – D was 52% and R was 40%, but we are six months aware from an election
- Today – Clinton is 46% and Trump is 35%
- Didn’t support trump in December but now do – Older employed white men born in US
- People who are less satisfied in life in 2014 more likely to support rump now
- Racial resentment, white racists predict trump support [it said white ethnocentrism but I just can’t get behind hiding racism is pretty words]
Cross-national Comparisons of Polling Accuracy; Jacob Sohlberg, University of Gothenburg Mikael Gilljam, University of Gothenburg
- Elections are really great [ made me chuckle, good introduction 🙂 ]
- Seen a string of failures in many different countries, But we forget about accurate polls, there is a lot of variability
- Are some elections easier than other? Is this just random variance? [well, since NO ONE uses probability sampling, we really don’t know what MOSE and MONSE is. ]
- Low turnout is a problem
- Strong civil society has higher trust and maybe people will be more likely to answer a poll honestly
- Electoral turnover causes trouble, when party support goes up and down constantly
- Fairness of elections, when votes are bought, when processes and systems aren’t perfect and don’t permit equal access to voting
- 2016 data
- Polls work better when turnout is high, civil society is Truong, electoral stability is high, vote buying is low [we didn’t already know this?]
- Only electoral turmoi is statistically significant in the Multivariate analysis
Rational Giving? Measuring the Effect of Public Opinion Polls on Campaign Contributions; Dan Cassino, Fairleigh Dickinson University
- Millions of people have given donations, it’s easier now than ever before with cell phone and Internet donations
- Small donors have given more than the large donors
- Why is Bernie not winning when he has consistently out raised Hillary
- What leads people to give money
- Wealthy people don’t donate at higher rates
- It’s like free to play apps – need to really push people to go beyond talking about it and then pay for it
- Loyalty base giving money to the candidate they like, might give more to her if they see her struggling
- Hesitancy based only give if they know they are giving to the right and iodate, so they wait
- Why donate when your candidate seems to be winning
- Big donors get cold called but no one gets personality phone calls if you’re poor
- Horse race coverage is rational, coverage to people doing well, don’t really know about their policies
- Lots of covereage on Fox News doesn’t mean someone is electable
- People look at cues like that differently
- In 2012 sometimes saw 5 polls every day, good for poll aggregators not good for people wanting to publicize their poll
- You want a dynamic race for model variance
- Used data from a variety of TV news shows, Fox, ABC, CBS, NBC
- Don’t HAVE to report donation under $200, many zero dollar contributions – weirdness needed to be cleaned out
- Predict contributions will increase when Romney is threatened in the polls
- Predict small contributions will increase in response to good coverage on Fox News
- Fox statements matter for small contributors, doesn’t matter which direction
- Network news doesn’t matter for small contributors
- Big donor are looking for more electable candidates so if fox hates them then we know they’re electable and they get more money
- Romney was a major outlier though, the predictions worked differently for him
Rights Of Respondents #AAPOR
Live note taking at #AAPOR in Austin Texas. Any errors or bad jokes are my own.

Moderator: Ronald Langley, University of Kentucky
Examining the Use of Privacy Language: Privacy from the Respondent’s View; Kay Ricci, Nielsen Lauren A. Walton, Nielsen Ally Glerum, Nielsen Robin Gentry, Nielsen
- Respondents have concerns about the safety and security of their data, Want do know how data is stored, collected, We hear about breaches all the time now
- In 2015, FCC issued TCPA rules re automatic telephone dialling systems, can’t use them for cell phones without consent
- Existing page of legalize was terrifying and could affect key metrics
- 3 steps – in depth interviews, implemented language into TV diary screener, analyzed key metrics to understand impact of new language
- 30 English interviews, 16 Spanish interviews
- Did people notice the language, read it, skim it, did they care? Did they understand the terms, was the language easy or difficult
- Tested several versions, tested a longer version with softer language
- Only one person understood what an autodialler was, people didn’t realize it was a live interviewer, people didn’t care how their number was dialled if they were going to talk to a live human anyways
- 2/3 didn’t like the concept, thought they’d be phoned constantly, 1/3 didn’t mind because it’s easier to hang up on a machine
- People liked we weren’t selling or marketing products, but many don’t see the difference
- Many people don’t know who neilsen is
- People liked being reminded that it was voluntary, extra length was fine for this
- The after version was longer with more broken up sentences
- Test group had lower return rate but very slightly, lower mail rate
- Higher return rate for 50 plus, and Hispanic
- Contact number provision was much lower, drop from 71% to 66%
- It’s essential to protest so you know the impact
- [simple language is always better even if it takes more space]
Allowing Access to Household Internet Traffic: Maximizing Acceptance of Internet Measurement; Megan Sever, Nielsen Sean Calvert, Nielsen
- How do we measure what people watch and buy online in their home
- How do we access third party data , but then how do we great true demographic information to go with it
- 22 semi structured interviews – mock recruit into please share your password
- Ranges from absolutely yes – they believe it’s already being collected anyways
- Sceptics wanted more information – what are you actually recording, how is my data secure
- Privacy – security – impact on Internet performance
- People seemed to think they would Screencap everything they were doing, that they could see their bank account
- Brought examples of real data that would be collected, what the research company will see, essentially lines of code, only see URL, not the contents of the page, start and stop times; at this point participants were no longer concerned
- Gave a detailed description of encryption, storage and confidentially procedures
- Explain we’re not marketing or selling and data is only stored as long as is necessary
- Reputation of the research company builds trust, more familiar folks were okay with it
- Script should describe purpose of measurement, what will and will not be measured, how it will be measured, data security privacy and protection policies, impact on Internet performance, reputation of company
- Provide supplementary information is asked for – examples of data, policies that meet or exceed standards, examples of Internet performance, background and reputation of company
Informed Consent: What Do Respondents Want to Know Before Survey Participation; Nicole R. Buttermore, GfK Custom Research Randall K. Thomas, GfK Custom Research Jordon Peugh, SSRS; Frances M. Barlas, GfK Custom Research Mansour Fahimi, GfK Custom Research
- Recall the kerfuffle last year about what information should be told to respondents re sponsor or person conducting the research
- Recognized participants should be told enough information to give informed consent – but also if we are concerned about bias, then we can tell people they won’t be debriefed until afterwards; but companies said sometimes they could NEVER review the sponsor and they’d have to drop out of #AAPOR if this happened
- We worry about bias and how knowing the sponsors affects the results
- Sponsor information is a less important feature to respondents
- Do respondents view taking sureys as risky? What information to respondents want prior to computing surveys.
- Topic, my time, and my incentive are thought to be most important
- People were asked about surveys in general, not just this one or just this company
- 6% thought an online survey could have a negative impact
- Most worried about breaks of privacy, confidentially; less worried is survey is waste of time or boring, or might upset them
- 70% said no risk to mental health, 2% said high risk to mental health
- 23% said stopped taking a survey because it made them uncomfortable – made think more deeply about life, made them angry, made them feel worse about themselves, made them feel sad, or increased their stress
- Politics made them angry, bad questions made them angry, biased survey and too long survey made them angry [That’s OUR fault]
- Same for feeling stressed, but also add in finance topics
- Feel worse about self is the finance topic or health, or about things they can’t have
- Feel sad related to animal mistreatment
- People want to know how personal information will be protected, surely length, risks, topic, how results will be used, incentives, purpose of survey – at least one third of people [1/3 might not seem like a lot but when you’re sample is 300 people that’s 100 people who want to know this stuff]
- Similar online vs phone, incentives more important for online, one the phone people wan to know what types of questions will be asked
Communicating Data Use and Privacy: In-person versus Web Based Methods for Message Testing; Aleia Clark Fobia, U.S. Census Bureau Jennifer Hunter Childs, U.S. Census Bureau
- Concern about different messages in different place and they weren’t consistent
- Is there a difference between “will only be used for statistically purpose” and “will never be used for non statistical purposes”
- Tested who will see data, identification, sharing with other departments, burden of message
- Tested it on a panel of census nerds :), people who want to be involved in research, 4000 invites, 300 completes
- People were asked to explain what each message means, broke it down by demographics
- 30 cognitive interviews, think aloud protocol, reads sets of messages and react, tested high and low performing messages [great idea to test the low messages as well]
- FOcused on lower education and people of colour
- Understanding is higher for in person testing, more misunderstanding in online responses, “You are required by law to respond to the census (technical reference)” was better understood than listing everything in a statement
- People want to know what ‘sometimes’ means. And want to know which federal agencies – they don’t like the IRS
- People don’t believe the word never because they know breaches happen
- More negative on the web
- Less misunderstanding in person
- Easier to say negatives things online
- In person was spontaneous and conversation
- Focus on small words, avoid unfamiliar concepts, don’t know what tabulate means, don’t know what statistical means [they aren’t stupid, it’s just that we use it in a context that makes no sense to how they know the word]

Respondent Burden & the Impact of Respondent Interest, Item Sensitivity and Perceived Length; Morgan Earp, U.S. Bureau of Labor Statistics Erica C. YuWright, U.S. Bureau of Labor Statistics
- 20 knowledge questions, 10 burden items, 5 demographic questions, ten minute survey
- Some questions were simple, others were long and technical
- Respondents asked to complete a follow up survey a week later
- Asked people how hard the survey was related to taking an exam at school or reading a newspaper or completing another survey – given only one of these comparisons
- Anchor of school exam had a noticeable effect size but not significant
- Burden items – length, difficulty, effort, importance, helpfulness, interest, sensitivity, intrusive, private, burden
- Main effects – only sensitivity was significant, effect size is noticeable
- Didn’t really see any demographic interactions
- Burden length difficult; effort importance helpfulness interesting; sensitive intrusive private – these are the three factors
- Only first factor related to whether they would answer the second survey
- Females more likely to respond a second time
- More sensitive less likely to be answered again, more interestnig in would attract more women the second dime

Goodbye Humans: Robots, Drones, and Wearables as Data Collectors #AAPOR
Live note taking at #AAPOR in Austin Texas. Any errors or bad jokes are my own.
Moderator: Jamres Newswanger, IBM
Using Drones for Household Enumeration and Estimation; Safaa R. Amer, RTI International Mark Bruhn, RTI International Karol Krotki, RTI International
- People have mixed feelings about drones, privacy
- When census data is available it’s already out of date
- Need special approval to fly drones around
- Galapagos province census, new methodology used tablet to collect info to reduce cost and increase timeliness
- Usually give people maps and they walk around filling out forms
- LandScan uses satellite imager plus other data
- Prepared standard and aerial maps for small grid cells, downloaded onto tablet
- Trained enumerators to collect data on the ground
- Maps show roof of building so they know where to go, what to expect, maps online might be old, show buildings no longer there or miss new buildings
- Can look at restricted access, e.g., on a hill, vegetation
- Can put comments on the map to identify buildings no longer existing
- What to do when a building lies on a grid line, what if the entrance was in a different grid than most of the house
- Side image tells you how high the building is, get much better resolution with drone
- Users had no experience with drones or GIS
- Had to figure out how to standardize data extraction
- Need local knowledge of common dwelling opposition to identify type of structure, local hotels looked like houses
- Drones gave better information about restricted access issues, like fence, road blocks
- Drones had many issue but less time required for drones, can reuse drones but you can’t use geolisting
- Can extend to conflict and fragile locations like slums, war zones, environmentally sensitive areas
Robots as Survey Administrators: Adapting Survey Administration Based on Paradata; Ning Gong, Temple University
Nina DePena Hoe, Temple University Carole Tucker, Temple University; Li Bai, Temple University; Heidi E. Grunwald, Temple University
- Enhance patience reported outcome for surveys of children under 7 or adults with cognitive disabilities
- Could a robot read and explain the questions, it is cool and cute, and could reduce stress
- Ambient light, noise level, movement of person are all paradata
- Robot is 20 inches high, likes toys or friends, it’s very cute, it can dance, play games, walk, stand up, to facial recognition, speech recognition, sees faces and tries to follow you
- Can read survey questions, collect responses, collect paradata, use item response theory, play games with participants
- Can identify movements of when person is nervous and play music or games to calm them down
- Engineers, social researchers, and public health researchers worked together on this; HIPPA compliance

Wearables: Passive Media Measurement Tool of the Future; Adam Gluck, Nielsen; Leah Christian, Nielsen
Jenna Levy, Nielsen; Victoria J. Hoverman, Nielsen Arianne Buckley, Nielsen Ekua Kendall, Nielsen
Erin Wittkowski, Nielsen
- Collect data about the wearer or the environment
- People need to want to wear the devices
- High awareness of wearable, 75% aware; 15% ownership. Computers were 15% ownership in 1991
- Some people use them to track all the chemicals that kids come near everyday
- Portable People Meter – clips to clothing, detects radio and audio codes or TV and radio; every single person in household must participate, 80% daily cooperation rate
- Did research on panelists, what do they like and dislike, what designs would you prefer, what did younger kids think about it
- Barriers to wearing clothing difficulties, some situations don’t lend to it, it’s a conspicuous dated design
- Dresses and skirts most difficult becuase no pockets or belts, not wearing a belt is a problem
- Can’t wear while swimming, some exercising, while getting ready in the morning, preparing for bed, changing clothes, taking a shower
- School is a major impediment, drawing attention to is is an impediment, teachers won’t want it, it looks like a pager, too many people comment on it and it’s annoying
- It’s too functional and not fashionable, needs to look like existing technology
- Tried many different designs, LCD write and most prefered by half of people, others like the watch, long clip, jawbone, or small clip style
- Colour is important, right now they’re all black and gray [I’M OUT. ]
- Screen is handy, helps you know which meter is whose
- Why don’t you just make it a fitness tracker since it looks like I’m wearing one
- Showing the the equipment should be the encouragement they need to participate
- [My SO NEVER wore a watch. But now never goes without the wrist fitbit]
QR Codes for Survey Access: Is It Worth It?; Laura Allen, The Gallup Organization Jenny Marlar, The Gallup Organization
- [curious where the QR codes she showed lead to 🙂 ]
- Static codes never change; Dynamice works off a redirect and can change
- Some people think using a QR code makes them cool
- Does require that you have a reader on your phone
- You’d need one QR code per person, costs a lot more to do 1000 codes
- Black and what paper letter with one dollar incentive, some people also got a weblink with their QR code
- No response rate differences
- Very few QR code completes, 4.2% of completes, no demographic differences
- No gender, race differences; QR code users had higher education and were younger
- [wonder what would happen if the URL was horrid and long, or short and easy to type]
- Showing only a QR code decreased the number of completes
- [I have a feeling QR codes are old news now, they were a fun toy when they first came out]

Comparing Youth’s Emotional Reactions to Traditional vs. Non-traditional Truth Advertising Using Biometric Measurements and Facial Coding; Jessica M. Rath, Truth Initiative; Morgane A. Bennett, Truth Initiative; Mary Dominguez, Truth Initiative; Elizabeth C. Hair, Truth Initiative; Donna Vallone, Truth Initiative; Naomi Nuta, Nielsen Consumer Neuroscience Michelle Lee, Nielsen Consumer Neuroscience Patti Wakeling, Nielsen Consumer Neuroscience Mark Loughney, Turner Broadcasting; Dana Shaddows, Turner Broadcasting
- Truth campaign is a mass media smoking prevention campaign launched in 2000 for teens
- Target audience is now 15 to 21, up from 12 years when it first started
- Left swipe is an idea of rejection or deleting something
- Ads on “Adult Swim” incorporating the left swip concept in to “Fun Arts”
- Ads where profile pictures with smoking were left swiped
- It trended higher than #Grammys
- Eye tracking showed what people paid attention to, how long attention was paid to each ad
- Added objective tests to subjective measures
- Knowing this helps with media buying efforts, can see which ad works best in which TV show
New Math For Nonprobability Samples #AAPOR
Moderator: Hanyu Sun, Westat
Next Steps Towards a New Math for Nonprobability Sample Surveys; Mansour Fahimi, GfK Custom Research Frances M. Barlas, GfK Custom Research Randall K. Thomas, GfK Custom Research Nicole R. Buttermore, GfK Custom Research
- Neuman paradigm requires completes sampling frames and complete response rates
- Non-prob is important because those assumptions are not met, sampling frames are incomplete, response rates are low, budget and time crunches
- We could ignore that we are dealing with nonprobability samples, find new math to handle this, try more weighting methods [speaker said commercial research ignores the issue – that is absolutely not true. We are VERY aware of it and work within appropriate guidelines]
- In practice, there is incomplete sampling frames so samples aren’t random and respondents choose to not respond and weighting has to be more creative, uncertainty with inferences is increasing
- There is fuzz all over, relationship is nonlinear and complicated
- Geodemographic weighting is inadequate; weighted estimates to benchmarks show huge significant differences [this assumes the benchmarks were actually valid truth but we know there is error around those numbers too]
- Calibration 1.0 – correct for higher agreement propensity with early adopters – try new products first, like variety of new brands, shop for new, first among my friends, tell others about new brands; this is in addition to geography
- But this is only a Université adjustment, one theme, sometimes it’s insufficient
- Sought a Multivariate adjustment
- Calibration 2.0 – social engagement, self importance, shopping habits, happiness, security, politics, community, altruism, survey participation, Internet and social media
- But these dozens of questions would burden the task for respondents, and weighting becomes an issue
- What is the right subset of questions for biggest effort
- Number of surveys per month, hours on Internet for personal use, trying new products before others, time spend watching TV, using coupons, number of relocations in past 5 years
- Tested against external benchmarks, election, BRFSS questions, NSDUH, CPS/ACS questions
- Nonprobability samples based on geodemogarphics are the worst of the set, adding calibration improves them, nonprobability plus calibration is even better, probability panel was the best [pseudo probability]
- Calibration 3.0 is hours on Internet, time watching TV, trying new products, frequency expressing opinions online
- Remember Total Research Error, there is more error than just sampling error
- Combining nonprobability and probability samples, use stratification methods so you have resemblance of target population, gives you better sample size for weighting adjustments
- Because there are so many errors everywhere, even nonprobability samples can be improved
- Evading calibration is wishing thinking and misleading
Quota Controls in Survey Research: A Test of Accuracy and Inter-source Reliability in Online Samples; Steven H. Gittelman, MKTG, INC.; Randall K. Thomas, GfK Custom Research Paul J. Lavrakas, Independent Consultant Victor Lange, Consultant
- A moment of silence for a probabilistic frame 🙂
- FoQ 2 – do quota controls help with effectiveness of sample selections, what about propensity weight, matching models
- 17 panels gave 3000 interviews via three sampling methods each; panels remain anonymous, 2012-2013; plus telephone sample including cell phone; English only; telephone was 23 minutes
- A – nested region, sex, age
- B – added non nested ethnicity quotas
- C – add no nested education quotas
- D – companies proprietary method
- 27 benchmark variables across six government and academic studies; 3 questions were deleted because of social desirability bias
- Doing more than A did not result in reduction of bias, nested age and sex within region was sufficient; race had no effect and neither did C and those made the method more difficult; but this is overall only and not looking at subsamples
- None of the proprietary methods provided any improvement to accuracy, on average they weren’t powerful and they were a ton of work with tons of sample
- ABC were essentially identical; one proprietary methods did worse; phone was not all that better
- Even phone – 33% of differences were statistically significant [makes me think that benchmarks aren’t really gold standard but simply another sample with its own error bars]
- The proprietary methods weren’t necessarily better than phone
- [shout out to Reg Baker 🙂 ]
- Some benchmarks performed better than others, some questions were more of a problem than others. If you’re studying Top 16 you’re in trouble
- Demo only was better than the advanced models, advanced models were much worse or no better than demo only models
- An advanced model could be better or worse on any benchmark but you can’t predict which benchmark
- Advanced models show promise but we don’t know which is best for which topic
- Need to be careful to not create circular predictions, covariates overly correlated, if you balance a study on bananas you’re going to get bananas
- Icarus syndrome – covariates too highly correlated
- Its’ okay to test privately but clients need to know what the modeling questions are, you don’t want to end up with weighting models using the study variables
- [why do we think that gold standard benchmarks have zero errors?]
Capitalizing on Passive Data in Online Surveys; Tobias B. Konitzer, Stanford University David Rothschild, Microsoft Research
- Most of our data is nonprobability to some extent
- Can use any variable for modeling, demos, survey frequency, time to complete surveys
- Define target population from these variables, marginal percent is insufficient, this constrains variables to only those where you know that information
- Pollfish is embedded in phones, mobile based, has extra data beyond online samples, maybe it’s a different mode, it’s cheaper faster than face to face and telephone, more flexible than face to face though perhaps less so than online,efficient incentives
- 14 questions, education, race, age, location, news consumption, news knowledge, income, party ID, also passive data for research purposes – geolocation, apps, device info
- Geo is more specific than IP address, frequency at that location, can get FIPS information from it which leads to race data, with Lat and long can reduce the number of questions on survey
- Need to assign demographics based on FIPS data in an appropriate way, modal response wouldn’t work, need to use probabilities, eg if 60% of a FIPS is white, then give the person a 60% chance of being white
- Use app data to improve group assignments
Data Quality Issues For Online Surveys #AAPOR
Moderator: Doug Currivan, RTI International Location: Meeting Room 410, Fourth Floor
Impact of ‘Don’t Know’ Options on Attitudinal and Demographic Questions; Larry Osborn, GfK Custom Research; Nicole R. Buttermore, GfK Custom Research Frances M. Barlas, GfK Custom Research Abigail Giles, GfK Custom Research
- Telephone and in person rarely offer a don’t know option but they will record it, offering it doesn’t improve data
- May not be the case with online surveys
- They offered a prompt following nonresponse to see how it changed results
- Got 4000 completes
- Tested attitudinal items – with, without, and with a prompt
- don’t know data was reduced after a prompt, people did choose an opinion, it was effective and didn’t affect data validity
- Tested it on a factual item as well, income, which is often missing up to 25% of data
- Branching income often helps to minimize nonresponse (e.g., start with three income groups and then each group is split into three more groups)
- 1900 completes for this question – 35k or below, > 35k, DK, and then branched each break; DK was only offered for people who skipped the question
- Checked validity by correlations with income related variables (e.g., education, employment)
- Lower rates of missing when DK is offered after nonresponse, it seems most missing data is satisficing
Assessing Changes in Coverage Bias of Web Surveys as Internet Access Increases in the United States; David Sterrett, NORC at the University of Chicago Dan Malato, NORC at the University of Chicago Jennifer Benz, NORC at the University of Chicago Trevor Tompson, NORC at the University of Chicago Ned English, NORC at the University of Chicago
- Many people don’t have Internet access but nowadays it’s much better, can we feel safe with a web only survey
- Is coverage bias minimal enough to not be worried – people who don’t have access to Internet
- It can be question by question, not just for the survey overall
- Coverage bias is a problem if there are major differences between those with coverage and without, if they are the same kinds of people it won’t matter as much
- Even when you weight data, it might not be a representative sample, weights don’t fix everything
- ABS – address based sampling design – as opposed to telephone number or email address based
- General social survey has information about whether people have Internet access and it has many health, social, political, economic issues; can see where coverage error happens
- Income, education, ethnicity, age are major predictors of Internet access as predicted
- What issues are beyond weighting on demographics
- For many issues, there was a less than 1% point coverage error
- For health, same sex marriage, and education, the differences were up to 7% point different
- Over time – bias decreased for voting, support for assistance of blacks; but error increased for spend on welfare, marijuana, getting ahead in life
- Saw many differences when they looked into subgroups
- [so many tests happening, definitely need to see replication to rule out which are random error]
- As people who don’t have Internet access become more different from people who have it, we need to be cognizant of how that skews which subset of results
- You can’t know whether the you are research is a safe one or not
Squeaky Clean: Data Cleaning and Bias Reduction; Frances M. Barlas, GfK Custom Research Randall K. Thomas, GfK Custom Research Mansour Fahimi, GfK Custom Research Nicole R. Buttermore, GfK Custom Research
- Do you need to learn your data [yes, because you don’t know if errors sit within a specific group of people, you need to at least be aware of the quality]
- Some errors are intentional, others accidental, or they couldn’t find the best answer
- Results did not change if no more than 5% of the data was removed
- Is there such a thing as too much data cleaning
- Cleaned out incremental percentages of data and then weighted to census, matched to census data as the benchmark
- Saw no effect with cleaning up to 50% of the data with one of the panels, similar with the second almost no effect of cleaning
- [given that different demographic groups have different data quality, it could matter by subsample]
Trap Questions in Online Surveys; Laura Wronski, SurveyMonkey Mingnan Liu, SurveyMonkey
- Tested a variety of trap questions, easy or hard, beginning or end – used the format of selecting an answer they specify
- 80% were trapped with the hard question
- [saddens me that we talk about ‘trapping’ respondents.. They are volunteering their time for us. We must treat them respectfully. Trap questions tell respondents we don’t trust them.]
- Tested follow ups and captcha
- Announcements didn’t result in any differences, picture verification question trapped about ten percent of people
- Captcha trapped about 1% [probably they couldn’t read it]
- Prefered the picture trap
- [I personally prefer using many questions because everyone makes errors somewhere. Someone who makes MANY errors is the problem, not someone who misses one question.]
- At the end of the survey, asked people if they remembered the data quality question – many people didn’t notice it
- One trap question is sufficient [wow, I disagree so much with this conclusion]
Identifying Psychosocial Correlates of Response in Panel Research: Evidence from the Health and Retirement Study; Colleen McClain, University of Michigan – MAPOR student paper winner
- People who are more agreeable are less likely to participate (big 5 traits)
- More conscientious are more likely to participate
- More agreeable people took longer to respond to the survey
- Conscientious people respondent more quickly
- More distrustful are less likely to check their records
- Effects were very small
- We need to consider more than demographics when it comes to data quality
What Are You? Measuring The Size, Characteristics And Attitudes Of The Multiracial Population In America #AAPOR
Live note taking at #AAPOR in Austin Texas. Any errors or bad jokes are my own.
Moderator: Richard Morin, Pew Research Center
Exploring New Ways to Measure Race/Ethnicity for the 2020 Census; Nicholas Jones, U.S. Census Bureau
- Focus is multiethnic Americans
- Increasing numbers of people don’t identify with the current categories, lobbying government to change the categories
- Can people find themselves more accurately and easily in the form
- [My thought – do we need a probability sample to learn about the best way to write an ethnicity question? I suggest no.]
- Want to explore separate questions and combined questions
- Middle Eastern or North African MENA category being considered
- [Why does the census ask about Race when it really is a question of Breed or Historical Origin? There is only one race – human]
- Test option to let people write in more specific details
- Also testing detailed checkbox question
- List the options in order of frequency of occurrence
- Testing instruction – Note, you may report more than one group. People were misreading “Mark X” as mark a single X even though it said “Mark X in one or more boxes
- Testing race, original, ethnicity. Also tested tested no terms at all “which category” [Which category is my favorite. I’ve moved pretty everything over to that style. It’s a huge help for the gender/sex/identity question.]
- Want to understand how multiracial groups respond, particularly since these groups are growing faster than others
- Want to talk about results by the fall
- [I really want to see the results of this!]
Measuring Hispanic Racial Identity:
A Challenge to Traditional Definitions of Race; Mark Hugo Lopez, Pew Research Cente;r Ana Gonzalez-Barrera, Pew Research Center
- Census leaves Hispanic as a separate question, came form the 7s
- Do you ask Hispanic or race first?
- What does “some other race” mean.. It tended to mean Mexican or Hispanic or Latin American.
- People consider Hispanic to be a race regardless of what the researchers want it to mean
- Hispanic identity is changing particularly when more have US parents
- It varies a lot depending on how you ask it
- If you ask directly people will tell you they are black or indigenous.
- Multiple choices maybe because people don’t find themselves in the list
The Size, Characteristics and Key Attitudes of Multiracial Americans; Juliana Horowitz, Pew Research Center Richard Morin, Pew Research Center
- Asked race question of same people over a time span
- Asked about parents and grandparent race
- Data included self report and parent race
- Included only mixed race in the data but they have demographic data on everyone
- 2.9% said they are only one race but based on their parents could be called mixed race
- another percent were mixed race based on grandparents
- does this mean the census is wrong? no, it’s different
- [LOVE the idea of asking about parents and grandparents, sort of gets to aculturation]
- race is fluid
- 30% mixed race people have seen themselves as being one race at some point, vice versa as well
- 6.9% are mixed race based on these definitions
- black native were called mixed race due to their grandparents information
- identity gap – when questions don’t reflect how people see themselves
- why don’t you say you’re mixed – were raised as one race and look like one race; treatment like discrimination can affect how your identity is felt
- sometimes people feel proud about being mixed race, some feel more open to other cultures because of it, half have felt discrimination because of it
- native people say if someone on the street saw them, they would say theyre white, but for black people they would be perceived as black
- amount of contact with family relatives determined how people felt about themselves [really points out how race is a silly concept. it’s a cultural and social concept.]
Do Multiracial Adults Favor One of their Background Races Over the Other: An Implicit Association Test; Annie Franco, Stanford University
- By 2050 one in five Americans will be multiracial
- Explicit vs implicit bias is important because some people will refuse to admit they are biased or won’t even know they are biased
- Measured bias based on self reports as well as implicit measures
- People can pair words together more quickly if the words are consistent with their beliefs
- 50% of white people show preference for their own group
- White/Asian attitudes are closer to Asian than white
- White/black are closer to black and are solidly positive on the black side
- [lots of details here, I might have mixed things up, ask for the paper]
- White/black express more positive view of blacks, white/Asian express less positive view of Asian
- There are definite differences in implicit/explicit views [think of this in relation to the upcoming election in terms of which candidate is inline with your implicit views]


